Before we cover the USD and precious metal charts, let’s take a look at some of the poor economic data that was released this past week. Prior to the FOMC .25% ‘dovish hike, inflation numbers came in and continue to run below the Fed’s 2% mandate, retail is swimming in a bloodbath with bankruptcies piling up across the board, and bond yields are falling as investors fear a policy error is being made by the Fed. Following Yellen’s interest rate bump, a terrible housing report was released on Friday, which put more icing on the TaperCaper cake. The New York Fed slashed its GDP NowCast on Friday for 2Q17 to 1.86%, down from 3% in March, and even worse for 3Q17, coming in at 1.5%.

Data points on housing…
“The past two times Homebuilder Sentiment hit a bubblicious 70, we were at the peak of the tech & credit/housing bubbles. Historical divergence between ecstatic HB Sentiment and lethargic builder housing demand… Fannie Mae buy/sell consumer sentiment is in the danger zone: more think it’s a good time to sell vs. a good time to buy…” – MHanson Advisors


Housing Starts Suffer Worst Streak Since Jan 2009, Permits Plunge… “For the first time since Jan 09, Housing Starts dropped for the 3rd month in a row in May, drastically missing expectations (-5.5% vs +4.1% exp.) with both March and April revised notably lower. Building Permits also tumbled in May and massively missed expectations (-4.9% vs +1.7% exp.). No one saw it coming…” – Zerohedge


This past week, the USD put in a lower low of $96.32, just below the 61.8% Fibonacci of $96.46, and closed at $97.14, a lower close than the previous week. Overall, the price ended in a higher high and a lower low than last week’s price range. There is a well-defined downtrend channel from the January high of $103.83 down to the low. The studies are all still negative, with the 100 EMA offering support along the 61.8% Fibonacci. If the price breaks down decisively again as it did through the 50 EMA and trend line drawn from the May 2014 low, we’re looking at the $94.50 to $95 range at the 78.6% Fibonacci level. Gold and Silver, along with the miners, will rally if the USD dumps that far near-term. We’re also entering a seasonal low period for the metals that spans from the end of June to mid-July. The window for a potential move in the metals is just ahead, but caution is warranted for lower price points before a pivot upward.
USD Weekly Chart…

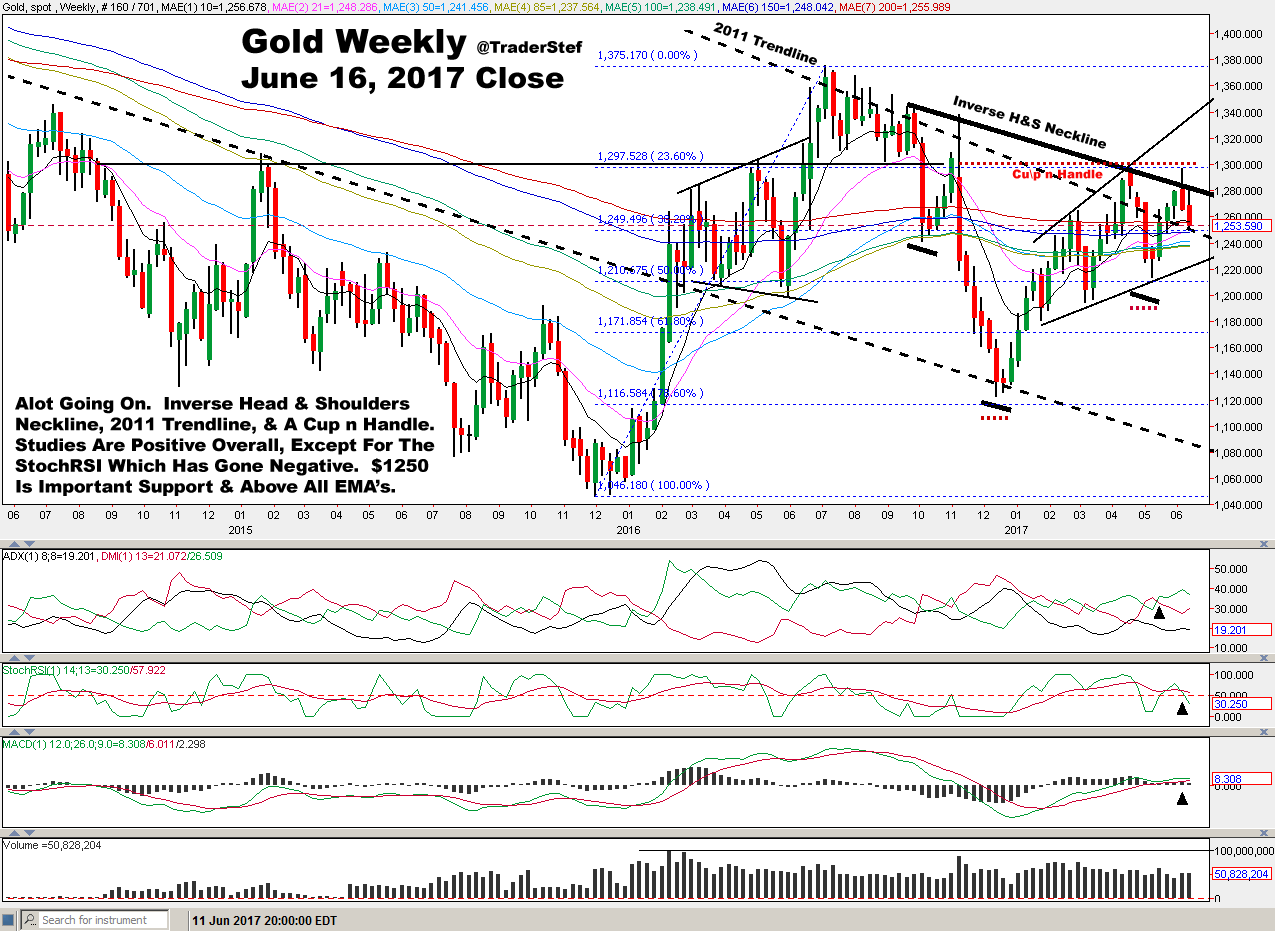
Gold Weekly Chart…
Silver Weekly Chart…

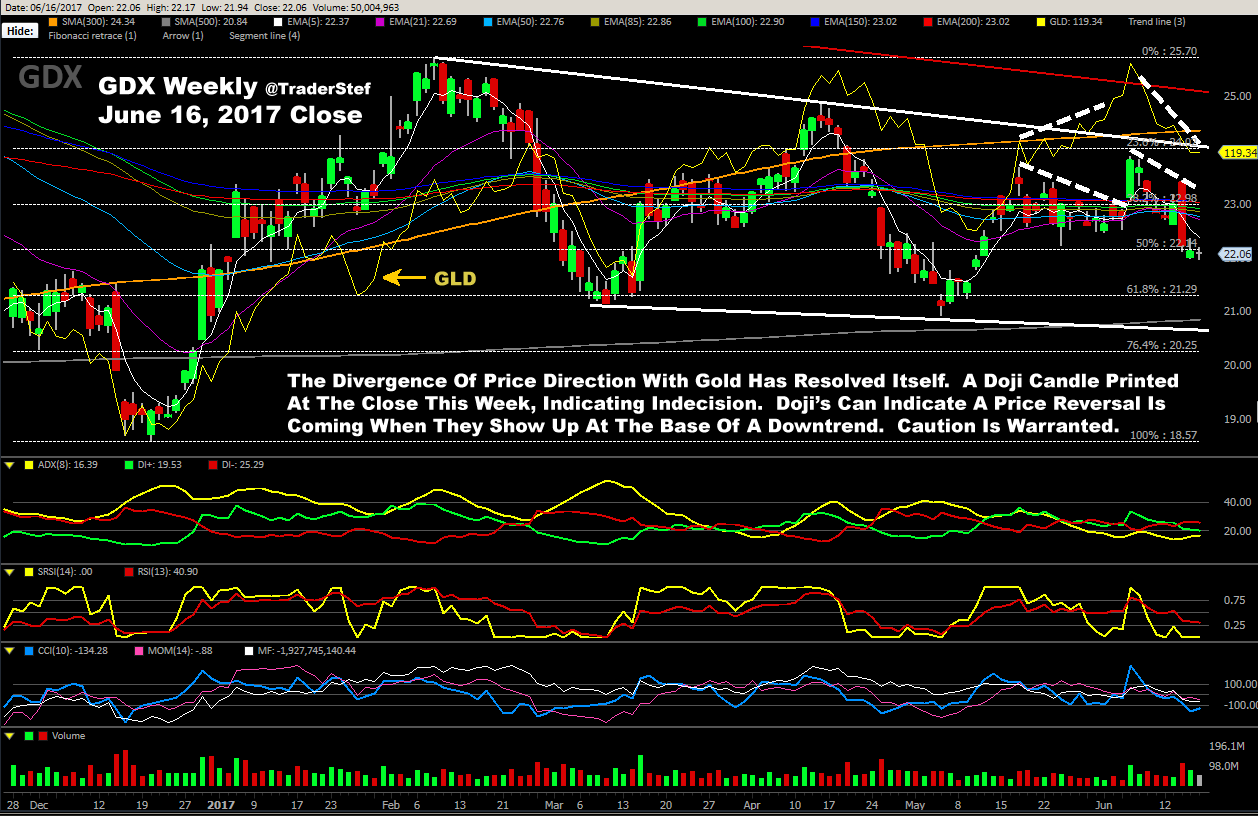
The divergence of price direction with Gold on the GDXJ and GDX has resolved itself.
The GDXJ basket of miners was rebalanced Friday, so keep your eyes on it.

Plan Your Trade, Trade Your Plan
TraderStef on Twitter