There is a hot debate in the financial universe about the risk of runaway inflation taking hold in the U.S. The concern is appropriate, as unprecedented monetary policy is flowing out of the Federal Reserve and Capitol Hill has launched an unending parade of multitrillion-dollar fiscal initiatives meant to shore up the economic fallout in a devasted economy caused by draconian lockdowns in a pandemic. You cannot help but notice the spike in housing prices due to metropolitan populations fleeing to the suburbs and rural areas, how the price of lumber has skyrocketed 340% from a year ago, several commodities are on fire, a bull market in stock indices continues that are not reflective of a healthy economy, and the national public debt is closing in on $30 trillion while clocking in at 130% of Gross Domestic Product (GDP).

Before digging into a rabbit hole filled with inflation, deflation, disinflation, and hyperinflation, it is wise to remember that one hard asset has remained a store of value with a few thousand years of stability to prove it. Gold may have experienced a few rounds of volatility over the last several decades, but it still maintains the value of your capital when so many other investments have come and gone like the weather.
One of many comparisons that demonstrate gold’s function as a store of value is the price of an ounce of gold vs. a men’s two-piece virgin wool business suit. The price of gold was held in check due to the Gold Reserve Act of 1934 and subsequent revaluation to $35. The retail price of that business suit averaged $40 during the 1950s, and a suit of similar quality in 2021 is roughly $400 while shopping on Amazon. That same $35 will not buy you that suit in 2021, but the same ounce of gold is good for at least four and will definitely afford you one high-end designer suit.

The limitation on private gold ownership after 1934 was repealed by President Gerald Ford when he signed a bill that legalized the ownership of gold coins, bars, and certificates by an Act of Congress, codified in Pub. L. 93–373 that went into effect Dec. 31, 1974. After comparing the price of gold to the median house price over the last century, the following data points stood out. I began with Dec. 1974 because the price of gold had already begun to reflect its value after President Nixon decoupled the U.S. dollar from gold in 1971 (aka Nixon Shock). I left out 1980 and 2011 due to the extreme price volatility but included Dec. 2019 before the pandemic took hold and Aug. 2020 for gold’s most recent high. Lastly, I added the average price from Jan. to Apr. 2021 for recent relevance.

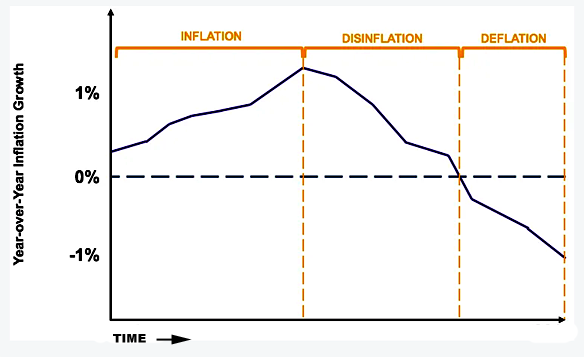
Let’s take a brief trip down the inflation rabbit hole and clarify a few things about where inflation in the U.S. economy may or may not go. When the term disinflation is used, it describes the slowing rate of price inflation. Disinflation is usually confused with deflation, which describes a negative rate of inflation (a close cousin of negative real interest rates).


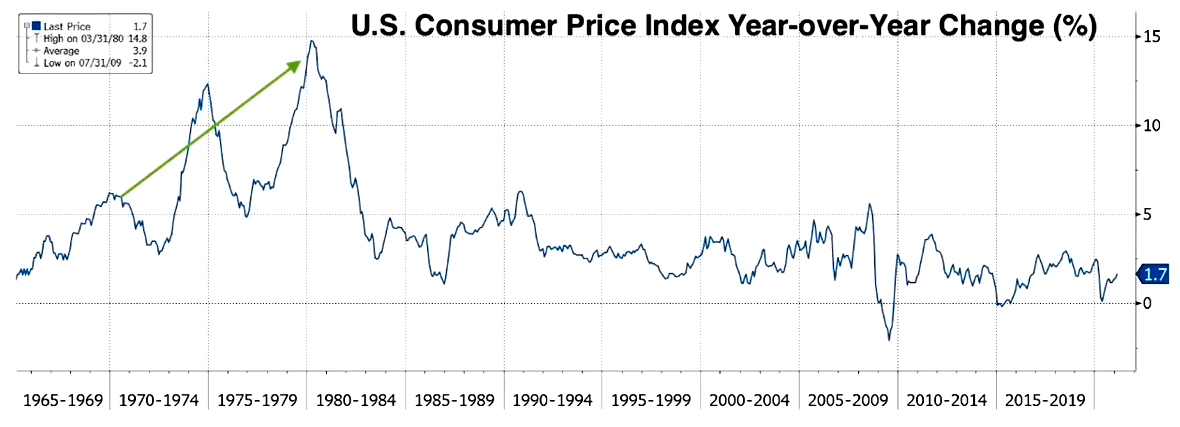
Keep in mind that inflation based on monetary policy (aka devaluation of the dollar) and its metrics are different than the headline Consumer Price Index (CPI) numbers that exclude food and energy.
U.S. CPI 1965-2021

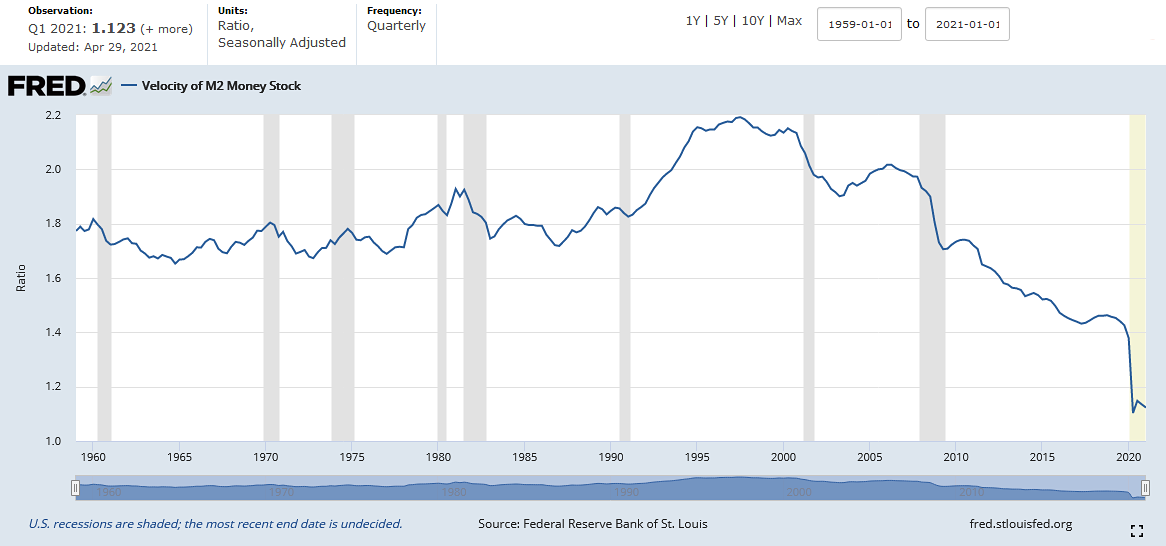
It is also important to realize that from the 1950s to the early 1980s, the U.S. economy was lightly indebted and the Velocity of Money (VoM) was relatively stable vs. the $30+ trillion in debt we currently face and the VoM collapsing. Every new dollar of debt was generating about 75 cents of Gross Domestic Product (GDP) growth during that time period. Due to the increasing level of sovereign debt since the 1980s, the rate of return on every new dollar of debt is diminishing.


A factor that made the 1970s and early 1980s so inflationary was that increases in the money supply were funneled directly into the real economy of Main Street. You can see that with the rise in GDP, CPI, M2 Money Supply, and the bump up in M2 VoM during that time period.
U.S. GDP Nominal Dollars vs Consumer Price Index

U.S. M2 Money Supply

Velocity of Money – M2 via FRED

Ever since the mid-1980s, the U.S. has become increasingly indebted, the rate of return on each new dollar of debt is only generating 35 cents of GDP growth, and the VoM is collapsing because the rate at which money is exchanging hands in the real economy is plunging, resulting in low inflation since the economy has become increasingly financialized as a whole.
Financialization: Why the Financial Sector Now Rules the Global Economy… “Historians of financialization typically place its origins in the late 1970s or during the 1980s. Sociologist Frank Dobbin concluded that ‘we saw a rapid shift in the core business of the United States, from manufacturing and not to services so much as to finance per se. As Simon Johnson pointed out, when the market peaked in 2001, finance accounted for 40% of profits in the American economy.’ A study by Lin and Tomaskovic-Devey shows that the ‘ratio of financial income to profits’ more than doubled during the 1980s and then accelerated further during the 1990s. ‘An increasing trend indicates a higher share of revenues coming from financial relative to non-financial sources of income…The ratio is remarkably stable in the 1950s and 1960s, but begins to climb upward in the 1970s and then increases sharply over the course of the 1980s. In the late 1980s, the ratio peaks at a level that is approximately five times the levels typical of the immediate post-war decades.’ Nor was this trend specific to the United States. The comparative data shows that most wealthy countries underwent similar transformation.’” – Mises Institute, Mar. 2020
When you have a large increase in the money supply and the VoM collapses to new all-time lows, the money supply is basically trapped in the financial markets. That is precisely why the housing market is trending into new bubble territory along with historically low interest rates, several commodities are rising significantly due to asymmetric supply chain disruptions, expectations of an economic boom with hopes of a dwindling pandemic, and stock market indices remain at or near all-time highs as investors seek profit and yield amidst a low interest rate and extremely accommodative monetary environment. If and when the VoM begins to rise significantly we will be on the doorstep of runaway inflation.
“Thus, our national circulating medium is now at the mercy of loan transactions of banks, which lend, not money, but promises to supply money they do not possess… When economies become extremely over indebted the VoM falls” – Irving Fisher, 1934
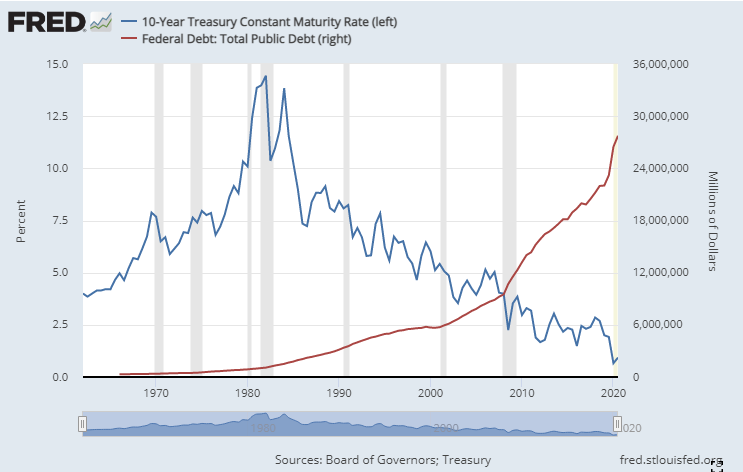
In a nutshell, the U.S. is creating more and more debt that is not going to generate an income stream to repay principal and interest, and that continues to push the VoM lower. If interest rates rise beyond 2-3% on the 10-year Treasury, we’re in deep trouble.

There is one door in the process of opening that might light a fire under inflation and is not a brilliant idea. Note that any asset or debt held on the Fed’s balance sheet (currently at $8 trillion) is not “money” circulating in the real economy.
If the Fed and Capitol Hill embark upon “The Naked Emperors’ Great Reset” path and incorporate a Central Bank Digital Currency (CBDC) monetary system, those digital dollars will be deposited directly into citizen accounts at the U.S. Treasury or Fed. That kind of “money” injection into society will likely create the greatest wave of hyperinflation the world has ever seen. For now, we’re stuck in a disinflation/deflation spiral downward.

All of the above factors are basics. There are many nuances to consider (business cycles, creative destruction, demographics, employment, evolution of technology, exogenous events, moral hazard, production function, supply and demand, wages) that are too detailed to explain in this short article that are covered by Lacy Hunt in the following interview. I highly recommend that you make the time to listen.
Dr. Lacy Hunt: Deflation and the Current State of the Economy – Inflation Today, But Deflation Tomorrow – Wealthion, Jun. 15, 2021
Plan Your Trade, Trade Your Plan
Website: TraderStef.com
Headline Collage Art by TraderStef


