I hope everyone enjoyed the Super Bowl weekend. Did you get the memo? Following all the events that took place last week, the markets could easily be trumped (pun intended) by what is yet to come. Let’s not drag our brains through all that mud. Instead, take a seat at my poker table with all us dogs, and let’s focus on just a few bones, nothing political. As always, to view a larger version of any chart, right-click on it and choose your “view image” option.
Breaking point: World financial system as stretched as before 2008 crash, says OECD banker… “The world financial system is as dangerously stretched today as it was at the peak of the last bubble but this time the authorities are caught in a ‘policy trap’ with few defenses left, a veteran central banker has warned. Nine years of emergency money has had a string of perverse effects and lured emerging markets into debt dependency, without addressing the structural causes of the global disorder. ‘All the market indicators right now look very similar to what we saw before the Lehman crisis, but the lesson has somehow been forgotten,’ said William White, the Swiss-based head of the OECD’s review board and ex-chief economist for the Bank for International Settlements.” – NZ Herald Jan. 24
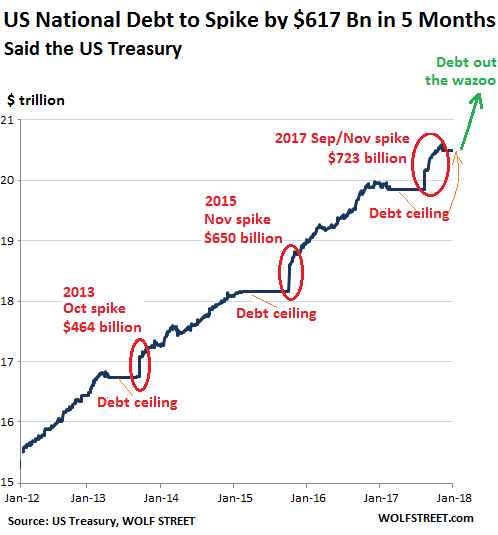
So, the national debt is about to spike again while the Fed is supposed to be tapering its 4+ trillion balance sheet and raising interest rates at the same time. Really?! It’s a Taper Caper, I’m telling ya. Wake me up when the illusion returns to reality. Don’t worry, you’re not a fund-a-mental case if you feel the same. It doesn’t matter who took that seat in the Oval Office – it was destined to be painful for the general public, and even more so if the lucky winner chose to actually take steps to improve the situation at hand. It is a big mess.
US National Debt Will Jump by $617 Billion in 5 Months… “So over the next five months, if all goes according to plan, the US gross national debt of $20.5 trillion (which includes $14.8 trillion in publicly traded Treasury securities and $5.7 trillion in internally held debt) will surge to about $21.1 trillion. That’s a 3% jump in just five months... The flat lines in 2013, 2015, and 2017 are a result of the prior three debt-ceiling fights. Each was followed by an enormous spike when the debt ceiling was lifted or suspended, and when the ‘extraordinary measures’ with which the Treasury keeps the government afloat were reversed. And note the current debt ceiling, the flat line that started in mid-December. In November, Fitch Ratings said optimistically that, ‘under a realistic scenario of tax cuts and macro conditions,’ the US gross national debt would balloon to 120% of GDP by 2027. The way things are going right now, we won’t have to wait that long. Back in 2012, gross national debt amounted to 95% of GDP. Before the Financial Crisis, it was at 63% of GDP. At the end of 2017, gross national debt was 106% of GDP!” – Wolf Street, Jan. 30
As shutdown deadline looms, GOP leaders eye yet another short-term spending bill… “With a shutdown deadline looming Feb. 8 and no long-term deal at hand, congressional Republican leaders said Thursday they will have to pass yet another short-term spending bill next week to keep the government open… Attempts to reach a longer-term deal have faltered amid a larger dispute over immigration and disagreement between the two parties about spending levels, as well as reluctance among some conservatives to sign off on massive new government spending in an election year.” – Chicago Tribune, Feb. 1

Government set to borrow nearly $1 trillion this year, an 84% jump from last year… “U.S. Treasury expects to borrow $955 billion this fiscal year… the highest amount of borrowing in six years, and a big jump from the $519 billion borrowed last year. Treasury mainly attributed the increase to the ‘fiscal outlook.’ The Congressional Budget Office (CBO) was more blunt. In a report this week, the CBO said tax receipts are going to be lower because of the new tax law. The uptick in borrowing is yet another complication in the heated debates in Congress over whether to spend more money on infrastructure, the military, disaster relief and other domestic programs. The deficit is already up significantly, even before Congress allots more money to any of these areas… What’s particularly jarring is this is the first time borrowing has jumped this much (as a share of GDP) in a non-recession time since Reagan was president.” – Chicago Tribune, Feb. 3
The next bull market is coming, it just won’t be in stocks… “It will be in the U.S. Treasury market which will coincide with the next recessionary drag in the economy within the next 12-18 months (at the most). I have written previously, interest rates have everything to do with economic growth. Since economic growth is almost 70% driven by consumption, with savings rates extraordinarily low and debt hitting record levels, small increases to interest rates will have an immediate negative impact on the consumptive capability of U.S. citizens. The chart below goes to my point. Currently, interest rates are 4-standard deviations above their 1-year moving average. (For an explanation read this.)

How often has this happened going back to 1965? Never. Negative events such as the S&L Crisis, Asian Contagion, Long-Term Capital Management, etc. all drove money out of stocks and into bonds pushing rates lower, recessionary environments are especially prone at suppressing rates further. Given the current low level of interest rates, the next recessionary bout in the economy will very likely see rates near zero. Furthermore, given rates are already negative in many parts of the world, which will likely be even more negative during a global recessionary environment, zero yields will still remain more attractive to foreign investors. This will be from both a potential capital appreciation perspective (expectations of negative rates in the U.S.) and the perceived safety and liquidity of the U.S. Treasury market. However, what you will notice is that each time rates were as overbought as they are currently, they coincided with either a recession, a correction, or a major market crash. Could this time be different? Sure. It’s possible. But probably, it won’t be.” – Lance Roberts at Real Investment Advice, Feb. 3
This Bond Bull Market Still Has Legs… “If you’re an economist or analyst trying to forecast markets based on the impact of rates on the economy, then you need to focus on real interest rates. Rates of 13% when inflation is 15% are actually stimulative. Rates of 3% when inflation is 1% are actually contractionary. In these examples, 2% is a ‘high’ rate and 13% is a ‘low’ rate once inflation is factored in. The situation today is much closer to the latter example.
The yield to maturity on 10-year Treasury notes is currently around 2.7%, the highest since the yield briefly touched 3% at the end of 2013. Inflation as measured by the PCE core deflator (the Fed’s preferred measure) is currently about 1.5% year over year. Using those metrics, real interest rates are about 1.2%, relatively high by historic standards.

The key question for analysts is whether these high real rates are justified by growth expectations and expectations of higher inflation, or whether they will act as a drag on growth in a weak economy that cannot bear such high rates. A lot depends on the answer to that question. Right now the ratio of stock returns to bond returns is near a quarter-century high. The last two times this ratio showed similarly elevated levels were just before the dot-com crash in 2000 and just before the stock market meltdown in 2008.
There are essentially two ways for this extreme ratio to normalize. The first form of normalization would be if stock values decline sharply and bonds rally on lower rates (producing larger capital gains) and a flight to quality. This is what happened after 2000 and 2008. The second form of normalization would be if bond returns soar on much higher interest rates. Those rate increases would have to be extreme to offset capital losses from the same rate increases. Stocks would crash in the face of those much higher rates. This is what happened in 1980–82, which at the time was the worst U.S. recession since the Great Depression.” – Jim Rickards at Daily Reckoning, Jan. 29
As of Friday’s close, the 10-year Treasury yield closed at 2.84%. Based on the $TNX chart, it appears yields still have room to move to the upside. The 3% sweet spot will trigger louder alarms than we have already heard from the mainstream financial media.

The DMI-ADX is looking rather bullish, but it does have a history of being short-lived on the TNX. Other studies, including what is on my chart, are beginning to look a bit toppy. IMHO, the overhead 200 EMA just above that 2000 trendline is the real trouble maker if it is taken out. Anybody in the bond bull arena MUST pay close attention here. Rates could run above the 200 EMA before any reversion to a bull in bonds. Right now, it’s looking near-term bearish, but bonds do remain bullish due to a lack of fundamental faith in monetary policy, the economy, and legislative fiscal responsibility.
On to the USD. In my January 24th article, I stated: “Thus far, this week’s candle has decisively breached the lower trendline of the Ascending Broadening Wedge, as well as taken out the 300-day simple moving average (SMA). There are several levels where the price will find intermittent support and chances for a bounce back. The first bus stop is a lateral from June 2010 at $88.70… an important trendline drawn up from the 2011 low sits at approximately $87. It gets dicey if that trendline is breached… The DMI-ADX continues with momentum to the downside and a perfect Alligator Tongue set-up. The StochRSI has bottomed out, but will likely remain a while longer. The RSI has also bottomed out, which is indicative of a bounce in price on the horizon. This chart remains Bearish across the board. I suspect the price will eventually reach that lower trendline, with some short chops along the way.”
Here is the USD weekly chart as of the Feb 2nd, 2018 close…

Last week, the USD opened at $90.53 and closed at $89.05. The high was $90.69 and the low was $88.43. This past week, the USD opened at $89.07 and closed at $89.19. The high was $89.63 and the low was $88.55. The $88.70 lateral drawn from 2008-2010 and the 61.8% Fibonacci at $88.42 formed a confluence, which prevented the price from collapsing further. It appears there may be a period of chop here, with a potential dead cat bounce, then off to lower lows. That lower trendline drawn up from 2011 appears to be a slam-dunk. The next significant level of support beyond that is another lateral drawn from 2012-2013 and is another confluence with a Fibonacci at the 78.6% at $84.23. The studies and moving averages continue to be negative, therefore the chart remains Bearish. I added the Bearish Head and Shoulders on this chart, as the lower trendline of the Ascending Broadening Wedge is now history.
On to gold…
A modern land run? Trump move opens Utah to mining claims under 1872 law – Reuters, Jan. 31
Bullion Bank Traders Arrested For Manipulating Market… “CFTC fines UBS, HSBC and Deutsche Bank millions of dollars each for gold price manipulation – Deutsche Bank ‘engaged in a scheme to manipulate the price of precious metals futures contracts’ – UBS ‘attempted to manipulate the price of precious metals futures contracts’ – HSBC engaged ‘in numerous acts of spoofing with respect to certain futures products in gold and other precious metals’ – Gold ‘experts’ continue to deny legal rulings, evidence amassed by GATA, admissions by banks and central banks including Greenspan and monetary history – Counter intuitively, gold bullion price suppression is good news for those prudent few who look at the situation ‘holistically’, take a long term view and buy gold and silver bullion as insurance.” – GoldCore, Feb. 1

China‘s Gold Consumption Rises 9.4% in 2017… “Demand for gold in mainland China returned to growth last year thanks largely to a growing appetite for jewelry, particularly in less affluent cities, new figures show. Consumption of the precious metal climbed 9.4% to 1,089 tonnes, according to data from the China Gold Association, released on Thursday. That represents a big turnaround from a 6.7% slump in demand in 2016, and means China maintains its crown as the world’s largest gold market for a fifth consecutive year. In 2017, appetite for gold jewelry was particularly robust in lower-tier cities as China’s newly accumulated wealth gradually spreads from affluent coastal areas to less developed regions. Gold demand could remain resilient this year – there are early signs the growth trend will continue… On the production side, however, domestic gold output fell 6% to 426.1 tonnes in 2017, the first ‘such slump’ since 2000, according to the China Gold Association. Still, the mainland remains the world’s top gold producer for an 11th straight year.” – South China Morning Post, Feb. 1

India’s gold imports surge 72% in December on high demand, weak global prices… “India’s gold imports rose by 71.52% to $3.39 billion in December because of weak global prices and higher domestic demand. According to the commerce ministry’s data released today, silver imports too rose by 106% to $197.26 million last month as against $95.84 million in December 2016. Gold imports by India, the world’s second-biggest consumer of gold, stood at $3.39 billion in December 2017 as against $1.97 billion a year ago.” – Times of India, Jan. 15
Australian Perth Mint’s January Gold Sales Surge 38% m/m, Silver jumps 22% – Kitco, Feb. 1
Russian banks ramping up gold purchases at record pace… “Russian banks ramping up gold purchases at record pace The Russian government has purchased two-thirds of all the gold mined in country, buying it from local banks to add to reserves as the Kremlin sees the precious metal as a safe haven at a time of geopolitical turbulence… According to the World Gold Council, the Russian Central Bank increased gold reserves by 163 tons, to 1,778 tons.” – RT, Feb. 1

Images of Russia’s massive gold and silver hoard at their central bank vault, via Rory Hall at The Daily Coin…
Here is the most recent Commitment of Traders (COT) data as of Jan. 30th, with a one-year gold chart overlay from the Feb. 2nd weekly close. In my January 24th article, I stated… “There is good reason to be concerned about near-term price action in gold as we close in on a significant resistance level of $1,380. The downside on the USD is being very generous to the gold price right now. The most recent COT report shows that the commercials (bullion banks) are once again accumulating a huge short position as open interest (OI) is reaching recent historic numbers. Large speculators (hedge funds) are heavily long right now as they add longs on the way up and add shorts on the way down. Commercials, on the other hand, layer short positions during a price rise, then layer long positions on the way down, while covering their shorts. Hedge funds are only interested in the MOMO play. 99% of the time, commercials lead price reversals, which tells us a decent-sized correction may be arriving shortly. There is always a chance that a news or fundamental data item, such as Mnuchin talking down about the USD today at Davos, could force commercials into a short squeeze situation, and the hedge funds will just pile in with additional longs until momentum runs its course. It is hard to call it until it’s seen in the price action, as COT reports are released on Tuesdays and the data is one week old. The data only gives a heads-up that a reverse in trend is approaching, but one cannot be sure on timing.”

And there you have it on the data, with the gold chart to reference. A drawdown of short positions by the commercials began last week. The commercials dumped a huge 16,244 short contracts and a paltry 6,678 long contracts as of Tuesday, Jan. 30th, according to the CFTC report. The hedge funds unloaded 7,485 long contracts and only 63 short. Last week, ending on Jan. 26th, gold opened at $1,334.77 and closed at $1,349.47. This past week, ending Feb. 2nd, the price closed at $1,332.73, just above a $1,331 Fibonacci on the daily chart. Woof.
In my January 24th article, I stated: “ The Sep. 2017 high at $1,357 was taken out today, but not decisively as I type this report. The price printed a high of day (HOD) at $1,362.18, with a sweet bullish soldier candle. The $1,380 Head & Shoulders Neckline and the $1,375 Cup & Handle Rim Line are only a stone’s throw away. Despite the positive price action, the COT report discussed above makes me nervous as we approach a significant resistance level. The commercials could take advantage of any news construed as gold-negative and run some stops to the south side and unload their short positions. On the other hand, they might get caught with their pants down, and we have a RYPO short squeeze move that rips through overhead resistance and on to $1,400. All the studies (DMI-ADX, StochRSI, MACD, and volume) look fabulous, but my gut says to wait. If you did not add any positions before the current price run, now is not the time to do so. It would be prudent at this time to wait for a decisive break through $1,380. If we get a pullback with some consolidation first, adding positions on that dip would be considered low-risk. My outlook is Neutral for new positions and Bullish on the price trend overall.”
Gold monthly and weekly, Feb. 2nd, 2018 close…


As expected, the commercials have won the contract battle for the near-term. Despite the chart remaining bullish overall and fundamentals being solid, I must stick with a Neutral near-term position call because the commercials still have a crapload of shorts to unwind and the large specs followed their lead by unloading some long positions. I recommend holding off with adding any new positions until the uptrend reasserts itself decisively. On several occasions since the December 2017 rally began, I suggested that chop and consolidation would take place, and I stated that it was preferred with such a strong move up. This is the third episode of shallow pullbacks since December. The longer it takes to backfill and consolidate before attempting to breach $1,380, the better. A stronger foundation is much better than a rocket shot with no supports along the way.
Take heed, cryptophants and Dow junkies: weak hands are painfully flushed on parabolic moves, and price destruction does not care about your feelings.
Plan Your Trade, Trade Your Plan
TraderStef on Twitter