Silver Is Refusing To Break Down. What Does That Mean For Precious Metals?
Gold and silver have recovered somehow from the recent breakdown. Gold has risen from its lows around $1,070 /oz to $1,120 earlier this week, while silver rose from its lows around $14,50 /oz to $15,50.
We noticed an extremely interesting thing when revising the charts.Usually, silver is moving with much more violence than gold. That is, to be clear, in both directions (up and down). Recently, however, we have seen gold breaking down sharper than silver. The following chart makes that point.

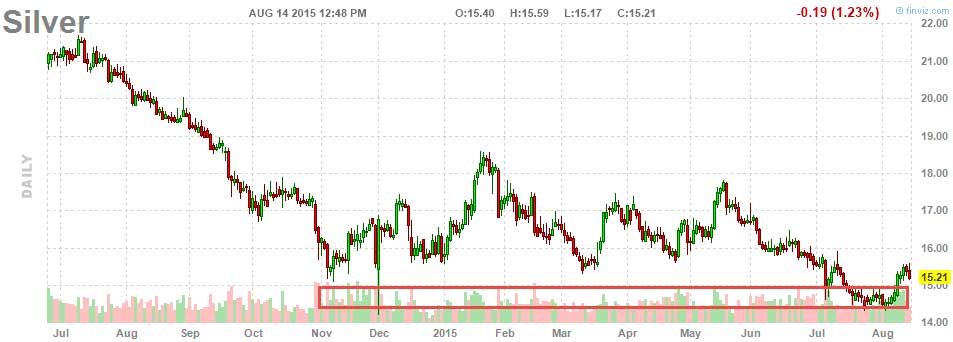
Note on the gold chart that gold dipped some 6% below its breakdown level at $1,150. In silver, however, we see an insignificant drop of 3% below the breakdown level at $15 /oz. Both charts indicate our point with the red rectangle (our annotation).
That is significant, because it indicates that silver is refusing to break down ‘big time.’
Readers who remember the collapse of precious metals in April and June of 2013, will recall the viciousness of the price crash in silver. There were several days on which silver lost more than 10% per day. That was a clear confirmation of a serious collapse.
That seems not to be the case this time.
The trillion dollar question is whether silver, being the ‘restless metal’, is signaling that the downside in the precious metals complex has become very limited. We believe that is how we should interpret it. Time will tell.