“One of the hardest things we have to do every day as traders (investors) is manage the information we get. There’s so much data and headlines that can persuade our decision making. Make the market prove to you it wants to do something, don’t try and prove to the market it should do something.” – Anthony Crudele
Gold has outperformed stock markets over the last 20 years by gaining roughly 560% vs. 80% against the MSCI All-Country World Index and 146% vs. the S&P 500.

A few obvious reasons for gold’s performance vs. equities overall is the extremely loose monetary and fiscal policy implemented by central banks and governments, and a financial situation that is much worse than it was after the Dotcom bubble, 9/11, and the Great Financial Crisis. Subsequent to the world taken hostage in 2020 by the worst pandemic since 1918, any hopium from the Goldilocks mainstream media has mutated into permanent fugazzi.
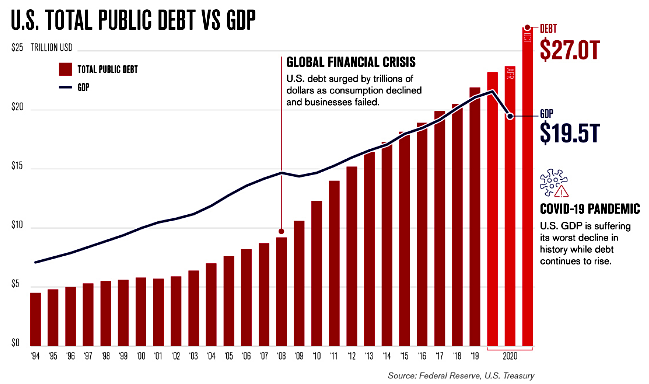
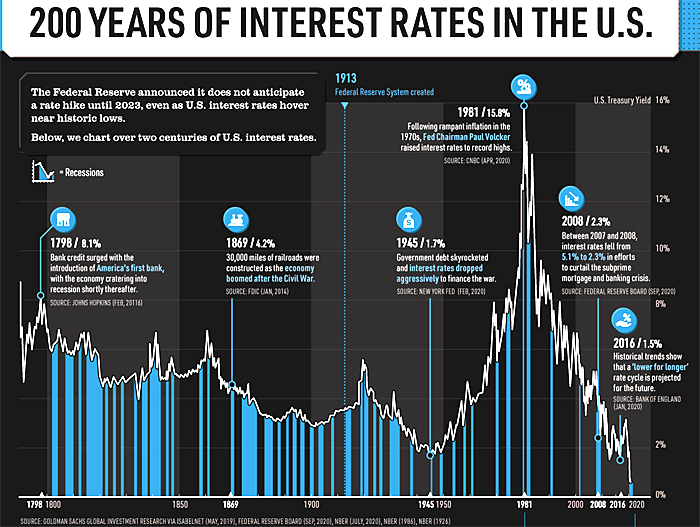
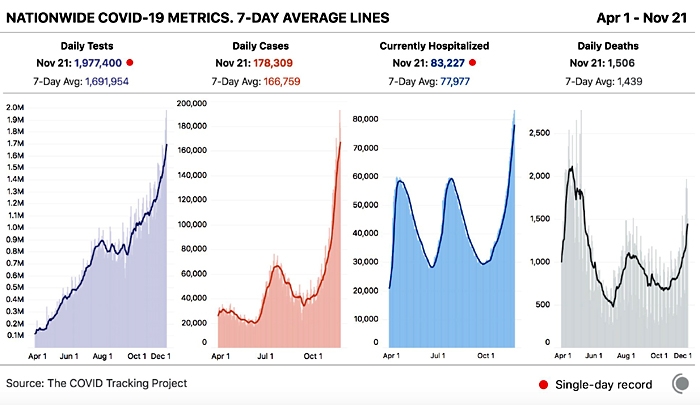
Adding fuel to the fire is the pandemic’s second wave exploding everywhere at the same time with infections soaring, hospitalizations nationwide overwhelming hospitals, and deaths that are all rising exponentially and dwarfing the spring and summer Herald Wave blips, which is heralding in a global depression with global debt rising beyond 277 trillion, the U.S. Fed balance sheet making new highs as Jay Powell warned last week that “we’re not going back to the same economy” and the U.S. national debt is passing 27 trillion, the Treasury is ending some of the emergency fiscal and financial plumbing funds while any new “stimulus” bill negotiation on Capitol Hill is on extended pause due to a Thanksgiving break and politicking at its most partisan ever, the U.S. presidential election final result remains in limbo, the labor market has begun to rollover from its initial claw back as lockdowns and localized restrictions increase across all 50 States and the world at large, U.S. interest rate policy is definitely zero-bound for years as negative yielding debt is breaking record highs, and the Great Reset is threatening to turn our current reality even more upside down into a globalist’s wet dream. What a mess we have on our hands and that brief synopsis barely scrapes the surface. Store some gold and silver under your mattress and cryptophants will be shocked when crypto wallets are ultimately disenfranchised.
The Bogus Case Against Gold… “I want to remind you of the three main arguments mainstream economists make against gold and why they’re dead wrong.” – Jim Rickards, Nov. 12
The Ultimate Store of Value… “Róbert Rékási, head of foreign exchange reserves management at the Central Bank of Hungary, speaks to Central Banking’s Victor Mendez-Barreira about how Covid-19 has changed gold investment trends.” Central Banking, Nov. 19


Let’s move onto a brief overview of gold’s price action since publishing “Is it Showtime Again? – Gold Technical Analysis” on Nov. 5. To view a larger version of any chart below, right-click on it and choose your “view image” option.
Gold Spot monthly chart as of Jul. 31, 2020 close with Fibonacci Extensions…

Excerpt from the Sep. 16 analysis:
“As noted on Aug. 2nd, a pullback that tests support at the 2011 $1,920 all-time-high was necessary after the price action had gotten ahead of itself within an overbought condition. The pullback began on Aug. 7th, but not until the first Fibonacci Extension at 23.6% was challenged… The chart remains bullish with an intact uptrend.”
Gold Spot weekly chart as of Nov. 5, at 5 pm EST…

Excerpt from the Nov. 5 analysis:
“Today’s price action was positive, but gold is not out of the woods despite an extensive period of consolidation since the $2,075 high printed in August… The dominant pattern is a Falling Wedge and today’s rally breached its topside trendline, the 50 EMA, and the $1,920 level with conviction, but I’m not convinced that this rally to $1,953 is a clean break. The holdup is three-fold. The DMI-ADX on the weekly and daily chart are not yet setup with a bullish Alligator Tongue, the StochRSI and Money Flow on the weekly have not broken out to the upside, and the downward Volume pattern since the Aug. 7 high has not printed a significant trend reversal. After $1,980 is successfully challenged and the indicators noted above improve, the road should be clear for a retest of the 23.6% Fibonacci Extension and beyond. The chart is bullish.”
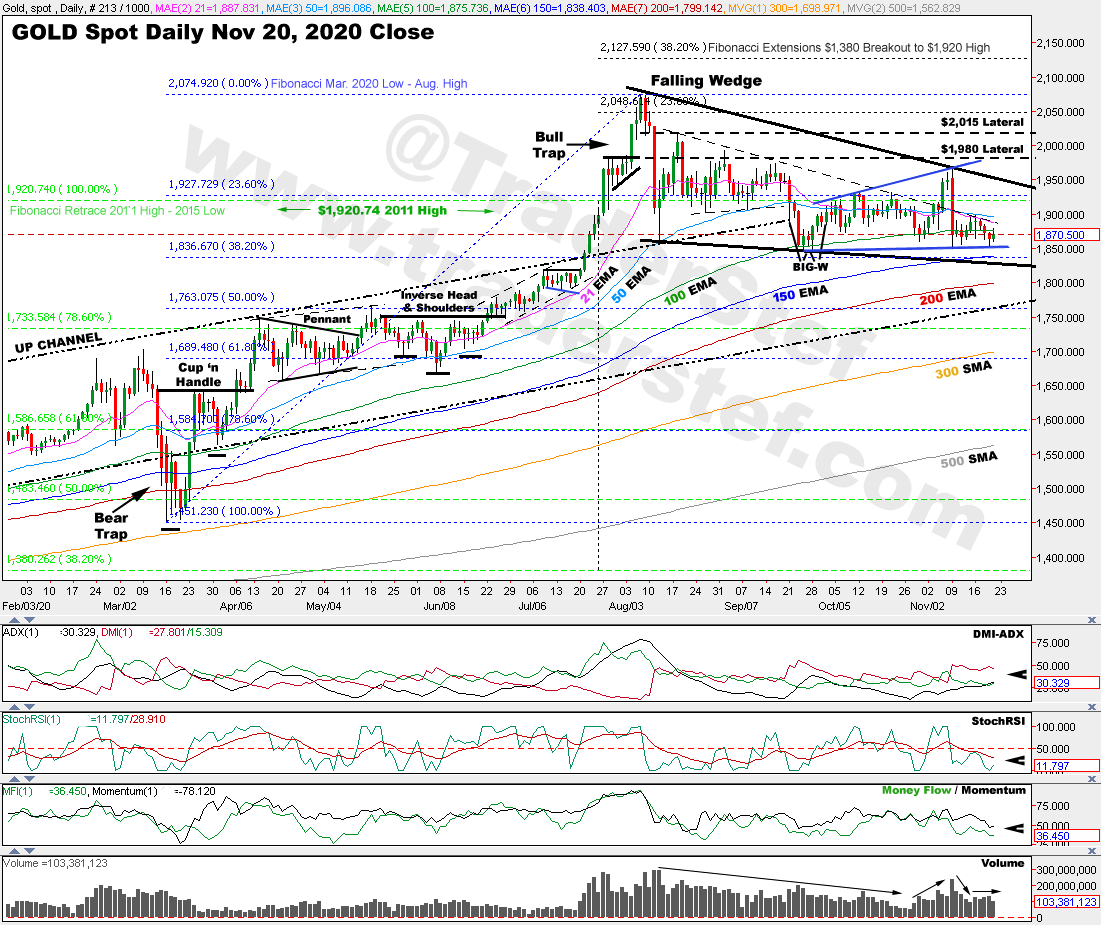
Gold Spot daily chart as of Nov. 20 close…

The typical fall seasonality pattern in the price of gold did not materialize and was primarily due to the lack of additional fiscal stimulus from Capitol Hill and a presidential election result remaining limbo. I suspect the usual pattern of a rising price as Christmas and the New Year draw near will still materialize no matter what happens in D.C. In the meantime, short of any major news event in the near-term, the price action will remain subdued as any vaccine headline that mattered has passed and the $1,850 level held with continued dip buying.
It is very clear on the daily chart that $1,920 became a major support and resistance level as expected. I was not convinced on Nov. 5 that the spike to $1,953 was a clean break and the analysis proved accurate the very next business day after two positive vaccine headlines whacked gold back under the $1,920 battle line. Despite the extended consolidation and chop, the price remains in a bullish uptrend since breaking away from the $1,380 Fibonacci level in Jun. 2019 after six years of resistance.
The 100 and 150 Exponential Moving Average (EMA) are providing support along with the $1,850 level, the DMI-ADX has not shifted into a uptrend momentum set-up, the StochRSI continues to bottom out into an oversold condition, the Money Flow and Momentum indicators have not turned upward, and Volumes are flat and steady since the price pullback from $1,953. The recent pullback manifested a rumor in the financial and precious metals media that a Death Cross occurred on the daily gold chart, and it is clear as day on my chart that it did not happen. In order for the price action to regain its upside momentum it must decisively retake the overhead 50 EMA and rally beyond $1,980 to challenge the 23.6% Fibonacci Extension and the Aug. $2,074 high.
The gold chart remains in a bull market long-term and I am neutral near-term until the holiday season draws near, but always stay alert for sweet spot scalping opportunities, savvies. Gold spot is trading at $1,874 as I close up shop this evening.
UPDATE NOV. 24, 2020 at 6:30am EST… Gold Weekly Chart… extreme oversold condition with no violation of the 50 EMA, uptrend bull remains intact…

Kitsune & The Little Rascals – Spanky Waiting
Plan Your Trade, Trade Your Plan
TraderStef on Twitter
Website: https://traderstef.com


