It is a good thing that heated debates about what money is or isn’t have resurfaced lately. Many well-thought-out opinions by seasoned financial folks, Johnny-come-lately types, and everything in between are permeating the mainstream and alternative media airwaves. If we also consider the evolving Space Economy, if E.T. is or has been here with us, we’ll be exchanging knowledge, technology, and resources – not cryptos.
Back to Earth for a moment… it is excruciatingly important to grasp the need for governance. At least in the United States of America, governance is expedited by political means within the constructs of a constitutional republic. The Native Americans had the Great Law of Peace. Good luck with money in the clouds to stir up the monetary mayhem while we struggle to keep the wheels of commerce and politics churning in a reasonable manner. Every human being should have the ability to achieve a level of digital commerce, and not just for the most fortunate or first-world nation states. There is a time and place for everything. A very good question is when this time is. The NSA was way ahead in 1996 with a war on cash.
So, which do we prefer: reasonable governance or sudden anarchy? One is more appealing to me when considering daily survival in our contemporary modern age, and in the U.S., we have had the most successful experiment in societal governance (and once upon a time, in monetary policy) to date, despite its shortcomings and overlords. Are we so immature that we have allowed our educational system to abandon a curriculum of financial competence, which has forced us to achieve monetary yield at such high risk that our young Americans are setting themselves up for tyranny by promoting only a digital form of money? Political correctness is also infecting the money debate. I seriously doubt that Neanderthals ever considered political correctness, and it’s a good thing too they didn’t, as we may have never survived this long.
Here are a few articles and interviews from the bunker to consider over the weekend before we move onto a technical analysis review of the latest gold charts.
“You cannot solve a political problem with a financial product. We have a governance system that doesn’t have integrity, within the governance system we have a financial system which is losing and doesn’t have integrity, and we’ve added on information systems that don’t have integrity. To think that we’re going to introduce a financial product on the information systems that don’t have integrity within a financial system that doesn’t have integrity, and within a governance system that’s going to have integrity, and that is going to change our integrity problem, your [sic] are dreaming. Especially because if you look at how the governance system and the financial system enforce, they enforce with force. Force is analog, it’s not digital. So if you have your cryptocurrencies on your ‘special secret decoder’ hard wallet offline, and the Feds walk in with a subpoena and guns pointing at your kids – children – wife – husband and say give us your private key, or you’re going to prison for the rest of your life, what are you going to do?… It absolutely is a centralizer, a Trojan horse promising one thing but delivering something quite different.” – Catherine Austin Fitts interview with the DarkJournalist, Dec. 2017
- The Dirty Secret of COMEX Gold Deliveries Revealed, EFP’d to London – Bill Holter
- COMEX Gold EFP’d to London: Letter to Commissioner of the CFTC – Harvey Organ
- A Gold Guys View of Crypto, Bitcoin, and Blockchain – Alex Stanczyk, at Medium
- Is Bitcoin Demand Hurting The Price Of Gold? – Investment Research Dynamics
- Made money in Bitcoin? Well done. Don’t wait until stampede, what to do now – GoldCore
- Physical Gold and Silver Are Not Investment Instruments, They Store Wealth – The Daily Coin
- Gold Will Soar As China Kneecaps the Dollar – Nick Giambruno, at Casey Research
- The Commitment of Traders Report (COT) Worm Has Turned – John Rubino Interview w/FSN
- Doug Casey on the Best Buying Opportunity Since 1971 – Doug Casey, at Casey Research
- Money As Greater Depression Deepens – 5 Classic Reasons Gold is Money – Doug Casey, at International Man
- State of Gold Today, Gold Mining Key Update – Amir Adnani Interview w/Future Money Trends
- My Last Great Bull Market – Blockchain, Then Gold! – Doug Casey Interview w/Future Money Trends
Before moving onto the current gold weekly and monthly charts, here is an outtake and daily chart from my recent analysis that was published on November 6th.
“Within the price pullback since September, there are two Falling Wedges. Price is now ‘basing out’ of the second. The 200 EMA is a solid support level, with seven taps upon it since the low of the first Falling Wedge. Support at the 38.2% Fibonacci is clear as well. If price breaches the 200 EMA to the downside, a target would be a pivot off the channel’s lower trendline. The studies are not as positive on the daily as they are on the weekly, which cautions that we may visit that channel trendline.”

The daily chart above from November 2016 to November 3rd, 2017 is roughly 1/3rd of a slice of the weekly below. I said then that the studies were not as positive on the daily as they were on the weekly, and I cautioned that the price may visit the lower trendline channel if the 200 Exponential Moving Average (EMA) was violated.
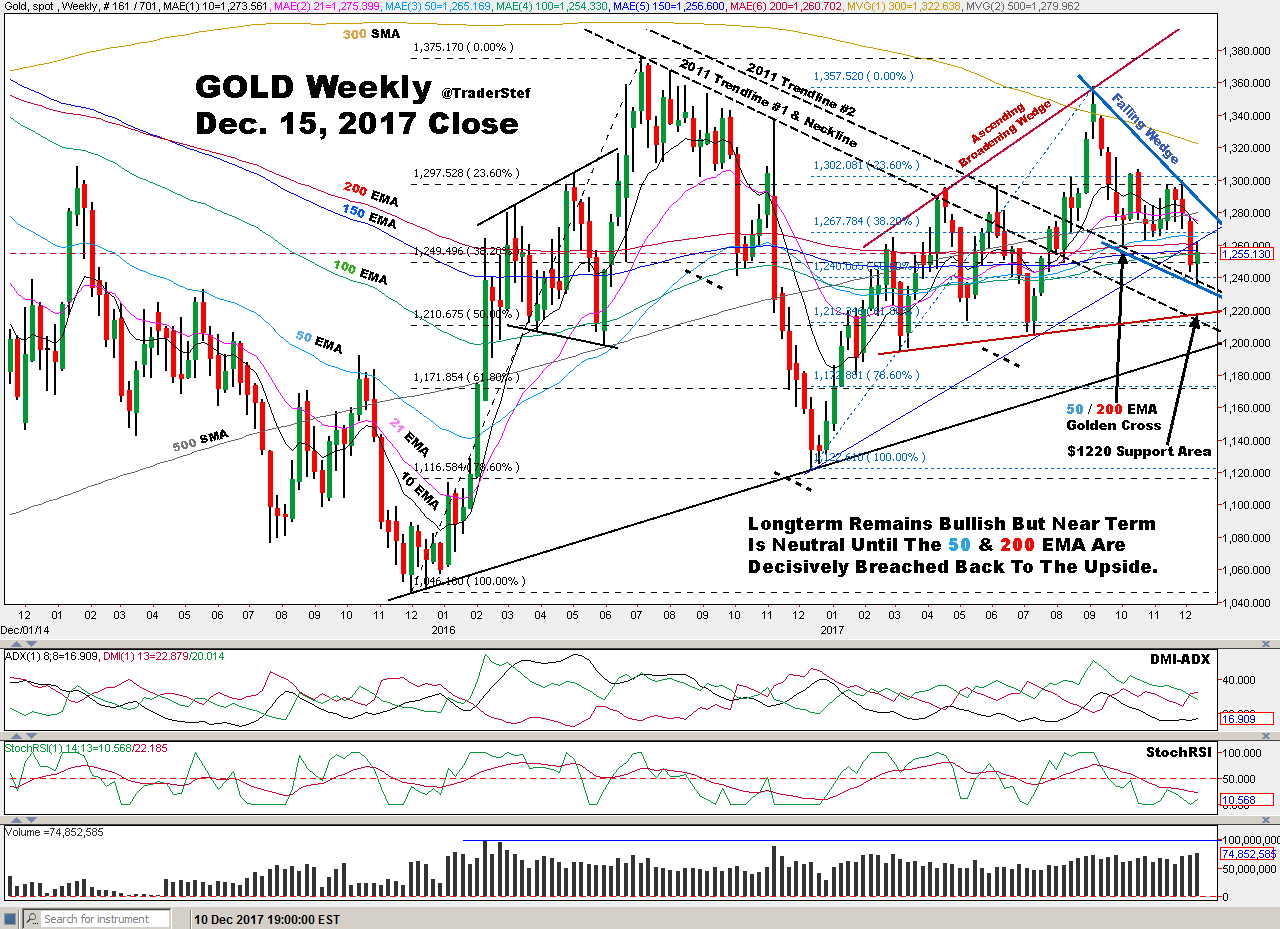
Looking at the current weekly, you can see where that lower thin blue trendline drawn up from the low of December 2016 was violated by the prior week’s candle, as well as violating the weekly 50 and 200 EMAs. This week’s candle continued a little further south to $1,236, just below the 50% $1,240 Fibonacci level, but the price closed higher this week than the prior week’s close of $1,243.
Since that lower blue trendline was violated during the prior week, it allows an addition of another pattern to the mix, an Ascending Broadening Wedge. Its lower red trendline sits at $1,220. The price tapped its topside trendline in early September 2017, followed by a bullish Falling Wedge to current time. The topside trendline of that falling wedge is at $1,280. The price action and patterns off the 2016 low to current are looking similar to the price action and patterns that occurred after 2015’s low pivot.
A few folks contacted me last week when the price was hovering around $1,260, and I explained that even if it broke down to the $1,220 support area, there would be no serious technical damage. As a matter of fact, $1,200 is the number for serious concern if you are looking for it, as the trendline drawn from the December 2015 low is currently sitting at $1,200 and is below trendline #1, drawn down from the 2011 high. Based on this week’s price action and the close at $1,255, there is more to go before getting concerned. The 2011 trendlines have not breached to the downside, and the Fed’s interest rate bump on Wednesday has had the same positive effect on price as it had on previous occasions.
Despite the pullback since September, this chart remains healthy, with higher lows intact since December 2015, but I’m in NEUTRAL here near-term until the price decisively breaks back above the 50 and 200 EMAs to confirm the Golden Cross remains in play. The Golden Cross has not broken down; we just need a confirmation because it’s a very important indicator on the weekly that has not taken place since the secular bull run in gold began back in 1999.
An accumulation phase with consolidation is still taking place. Gold’s secular bull phase will not reassert itself until $1,380 is breached with a vengeance.
Gold’s logarithmic monthly chart on Dec. 5, 2017. Nice.

Plan Your Trade, Trade Your Plan
TraderStef on Twitter