Let’s start with a clip from my August 31st article with charts…
“With all the focus on gold over the last few weeks, the mining stocks seem to be forgotten. Don’t do that. It’s time to pay close attention and evaluate your portfolio. Gold appears to be decisively taking out the topside Trendline that goes all the way back to the 2011 high, and the miners are happily following along.”
The weekly charts of the HUI Gold Bugs Index, GDX, and GDXJ ETFs all broke out above their respective 2011 Trendlines, along with the move in gold.
On to the charts to discuss what happened and where they stand now.
$HUI NYSE Arca Gold Bugs Index big picture…
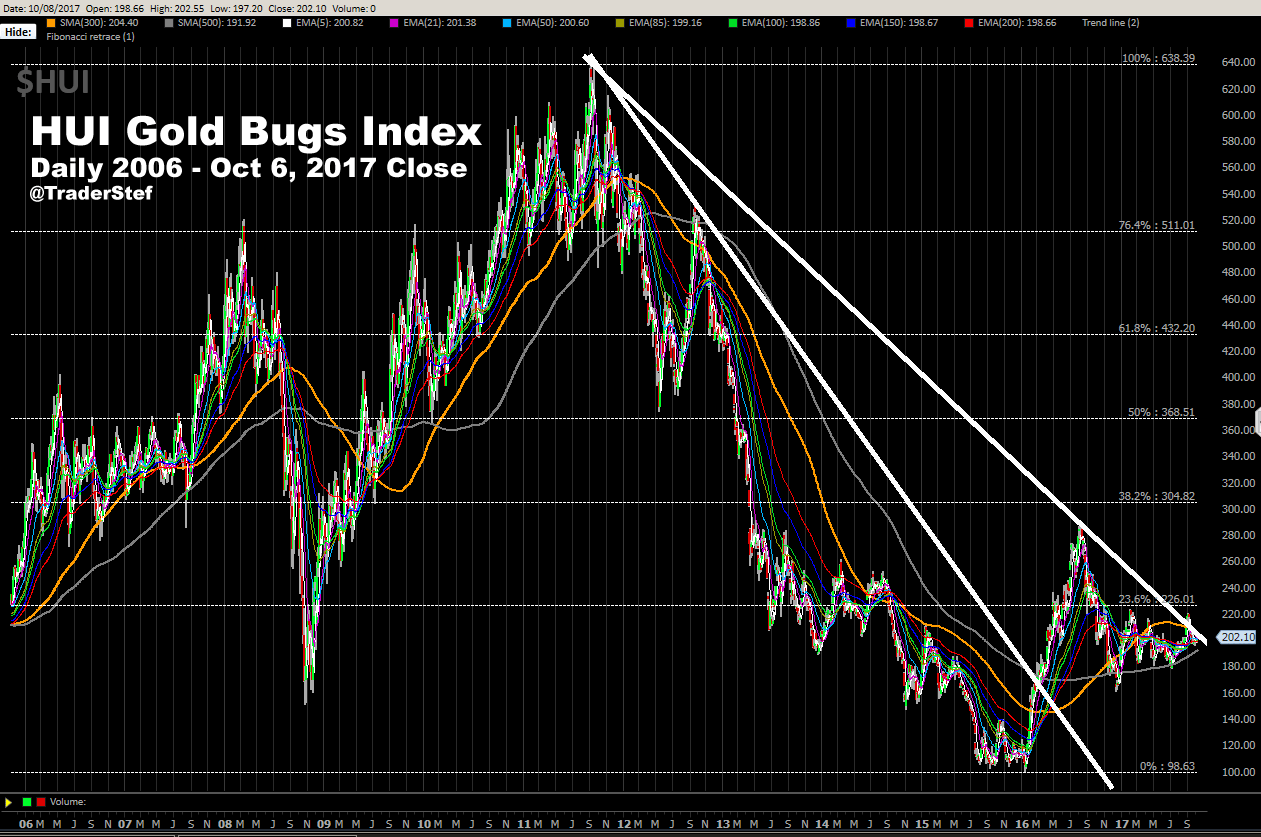
Zooming in on the HUI daily, we can see where the price broke out above the 2011 Trendline during the last week of August and into early September. Gold’s correction during September took the Miners along for the ride. The price broke back below the 2011 Trendline, then twice pivoted off a nearer-term Trendline drawn back from February. The price is now retesting the overhead 300-Day Moving Average and 2011 Trendline. Due to the correction, a consolidation process has extended further out in a coiling fashion within a bullish Ascending Triangle. The StochRSI, CCI, and Momentum studies are all positive. If the DMI-ADX can get its act together, price action should continue upward in the near-term and reach out to the topside Trendline of the Ascending Triangle. At that point, a decisive breakout is necessary for further price action to the upside.

Technical analysis for the GDX and GDXJ is almost identical to the HUI, with minor exceptions, so there’s no need to repeat. What is most important is the bullish Ascending Triangle on both. Here are the longer-term and zoomed-in daily charts with annotations.
GDX VanEck Vectors – Gold Miners ETF big picture…


GDXJ – VanEck Vectors Junior Gold Miners ETF big picture…


Plan Your Trade, Trade Your Plan
TraderStef on Twitter