The chart for the HUI Gold BUGS Index and the GDX/GDXJ ETFs have chopped sideways since December 2016, and all have formed bullish Ascending Triangle patterns along the way. Price is approaching a much tighter end of the formation, where something has to give sooner, rather than later. To view a larger version of any chart in this article, right-click on it and choose “view image.”
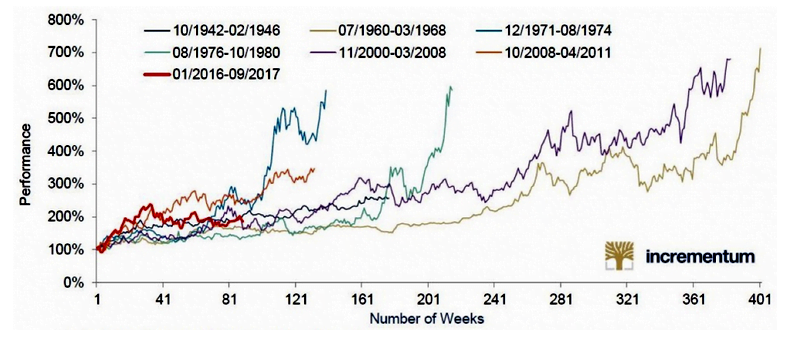
If You Only Look At One Chart… “Time is short, so here is one chart to get you thinking in a new direction. The start of something big? Gold Miners Trends since 1942.” – RealVision, Nov. 2017 (chart via Incrementum “In Gold We Trust” Report)

$HUI NYSE AMEX Gold BUGS Index…
What it is: The AMEX Gold BUGS Index (also known as HUI) is one of two major gold indices that dominate the market. BUGS is an acronym for ‘Basket of Unhedged Gold Stocks.’ The index was introduced on March 15, 1996.
How it works (Example): The AMEX Gold BUGS Index is made up exclusively of mining stocks that do not hedge their gold positions more than a year-and-a-half into the future. The Gold BUGS Index is comprised of 15 of the nation’s largest unhedged gold mining stocks. It is a modified equal-dollar weighted index. As a result, most of the index’s component stocks are equally weighted with the exception of a few of the largest stocks, which are more heavily weighted.
Why it Matters: The Gold BUGS Index and the Philadelphia Gold and Silver Index (XAU) are the two most watched gold indices on the market. HUI is more volatile. When gold prices are on the rise, the Gold BUGS Index provides an excellent way for investors to capitalize on that increase. The index has a high correlation to the spot price (current price) of gold. When the price of gold declines, the Gold BUGS Index tends to fall much faster than its hedged cousin, the XAU.
HUI Components – Basket Methodology…

HUI daily chart as of the Nov. 8 close…

You can see where the price broke out above the 2011 trendline #2 during the last week of August and into September. After peeking over the 38.2% Fibonacci for a third time since December 2016, momentum failed due to a pullback in the gold price, and gold’s correction through September took all the miners along with it. The HUI broke back below the 2011 trendline, then chopped sideways to retest the overhead 300-Day Simple Moving Average (SMA) and 2011 trendline. It failed to break back above them in October due to gold’s continued decline. HUI is now pivoting off the Ascending Triangle lower trendline for a third time. Three times and you’re out one direction or the other. The StochRSI and CCI studies are positive, but Momentum is flat. The DMI-ADX is rolling over and away from its negative trend, where price begins to trend upward. There’s a lot of resistance to conquer now, and they’re the same challenges encountered back in July, following the second tap of the Ascending Triangle lower trendline. A decisive break above all of the moving averages and 2011 trendline is needed to retest the Ascending Triangle topside. Gold will decide when and where – not the gold stocks.
Here is the list of gold stocks that make up the HUI…

GDX VanEck Vectors Gold Miners ETF as of the Nov. 8 close…

As with the HUI, the Ascending Triangle chart pattern and technicals are nearly identical. The difference is that price does not have as much work to do in order to break out of the overhead moving averages. The 500 SMA remains below, and price is currently knocking on the 2011 trendline, with the 50 Exponential Moving Average (EMA) a few cents away.
Here is a list of the top 10 gold stocks that make up the GDX…

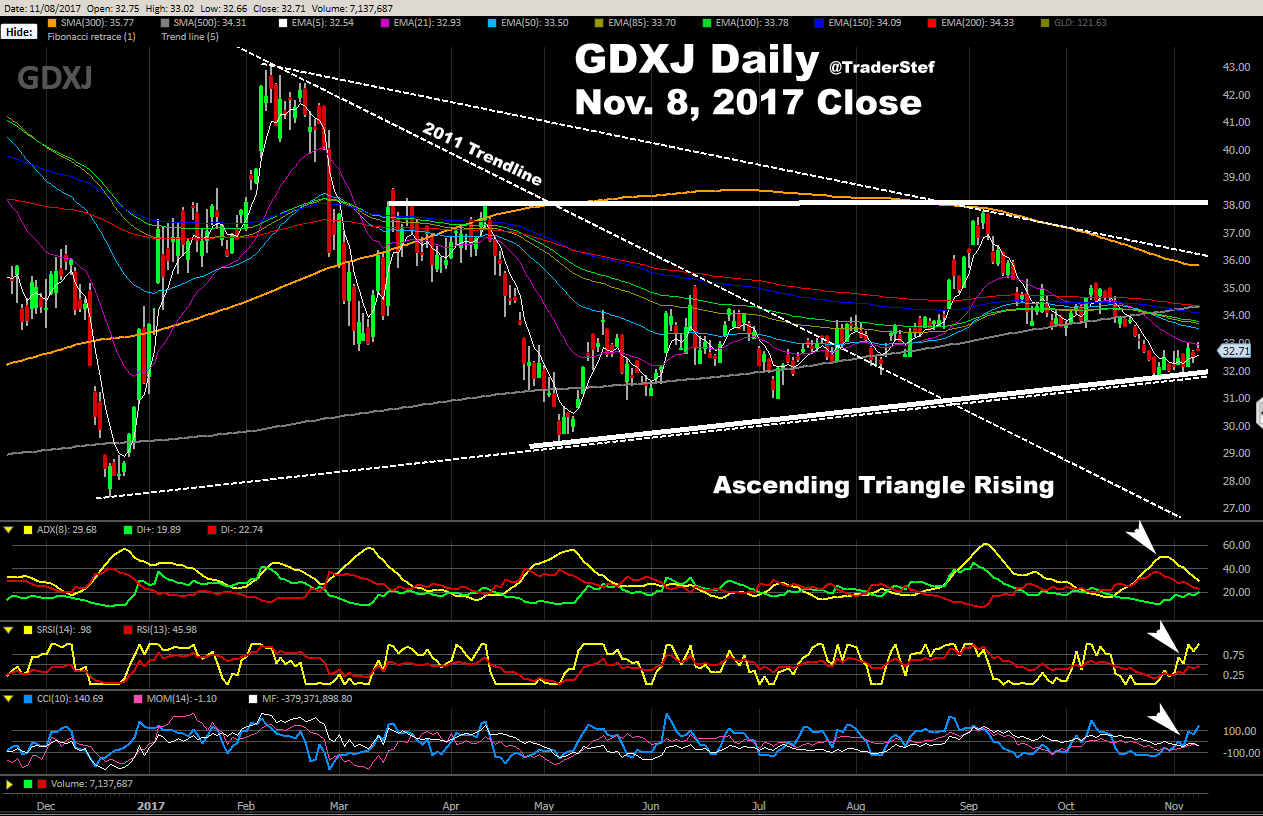
GDXJ – VanEck Vectors Junior Gold Miners ETF as of the Nov. 8 close…

As with the HUI and GDX, the Ascending Triangle chart pattern and technicals are nearly the same. The difference is that there is no 2011 trendline to retest, but like the HUI, all the moving averages are above the current price.
Here is a list of the top 10 gold stocks that make up the GDXJ…

Plan Your Trade, Trade Your Plan
TraderStef on Twitter
