Pee Wee was not afraid of Large Marge until some folks at the rest stop bar began whispering spooky things into his head. Nor should you fear the market as it breathes every now and then. Invest wisely and without emotion that muddy the facts you know to be true. Do I really need to go down a list of all that is happening in the world, as well as the fundamentals that remain ridiculously bullish for gold and silver? Nope. Have an awesome Happy New Year’s weekend, savvies! 2018 will certainly be another roller coaster ride to behold. To view a larger version of any chart in this article, right-click on it and choose ‘view image.’
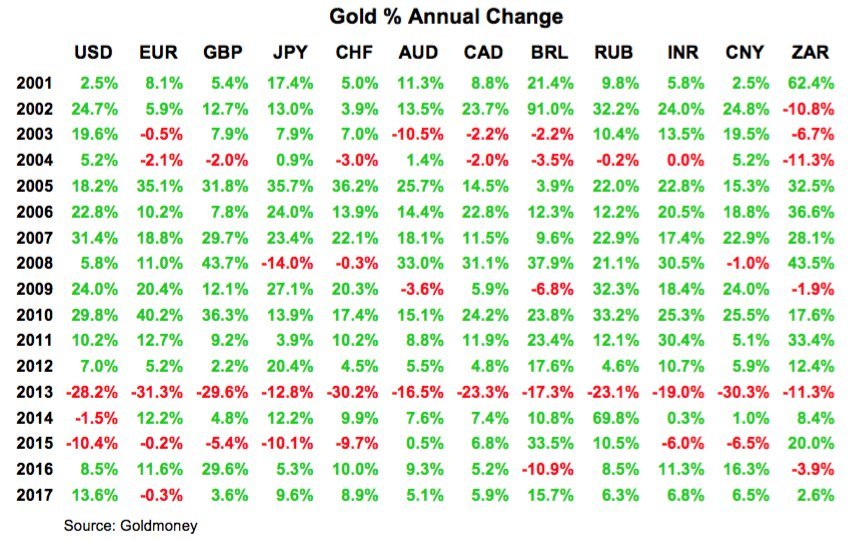
Here are a few data points to consider, and then end-of-year technical analysis charts for gold and the USD.

Here is an 8-year cycle chart, courtesy of Stefano Bottaioli. Read more about the cycles at the McClellan Market Report.

Gold’s 30-year seasonal patterns, courtesy of Dimitri Speck’s Seasonax, and the 20-year data points from Acting Man.


Gold vs. dollar ratio, courtesy of StockBoardAsset. A bullish cross over the 50 Simple Moving Average (SMA) has held for 5 months.

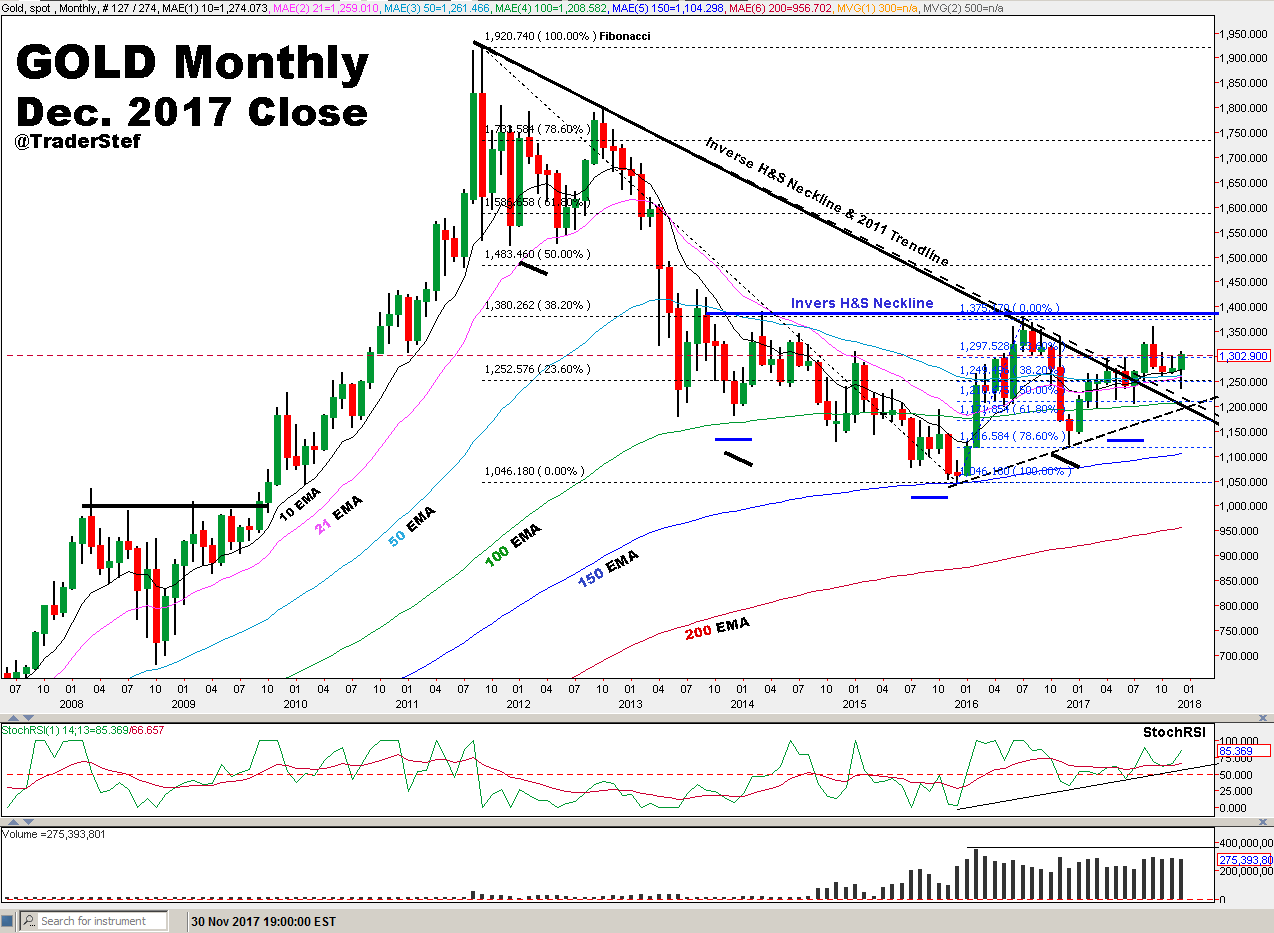
Gold monthly… I see nothing bearish about this chart. Gold remains in an accumulation phase, with higher lows before it takes a crack at reasserting the secular bull that began in 1999. $1,380 is the number to watch, as it is a potential Neckline of an Inverse Head and Shoulders to destroy with a decisive move, and there sits a confluence of resistance. Kimble Charting Solutions, along with some other good analysts, also see that Neckline as the main door to a liftoff rally.

Before looking at the current weekly chart, here is the weekly chart and a partial quote from my analysis published on December 15th, with emphasis on what’s bolded.

“…you can see where that lower thin blue trendline drawn up from the low of December 2016 was violated by the prior week’s candle, as well as violating the weekly 50 and 200 EMAs. This week’s candle continued a little further south to $1,236… but the price closed higher this week than the prior week’s close of $1,243… Based on this week’s price action and the close at $1,255, there is more to go before getting concerned. The 2011 trendlines have not breached to the downside, and the Fed’s interest rate bump on Wednesday has had the same positive effect on price as it had on previous occasions. Despite the pullback since September, this chart remains healthy, with higher lows intact since December 2015, but I’m in NEUTRAL here near-term until the price decisively breaks back above the 50 and 200 EMAs to confirm the Golden Cross remains in play. The Golden Cross has not broken down; we just need a confirmation because it’s a very important indicator on the weekly that has not taken place since the secular bull run in gold began back in 1999. An accumulation phase with consolidation is still taking place. Gold’s secular bull phase will not reassert itself until $1,380 is breached with a vengeance.”

Gold weekly Dec. close… The gold price began its pivot and subsequent rally on Wednesday, Dec. 13th, following Yellen’s .25% interest rate hike and transitory Fed-speak nonsense. The price quickly and decisively breached back above the Golden Cross and pierced the Falling Wedge topside trendline, flipping the trend back to bullish. Remember, the last time gold had a definitive Golden Cross on the weekly chart was at the turn of the century, marking gold’s secular bull run. Any cash on the sidelines is watching it very closely. The next resistance levels are the 78.6% Fibonacci and overhead 300 Simple Moving Average (SMA) that are sitting at $1,321, then $1,357 from the Sept. 2017 high is next before the magic number of $1,380. The StochRSI is stoked, and the DMI-ADX has crossed back over into the positive, but the ADX has not yet risen from the underside to form an Alligator Tongue to confirm an exceptional longer-term momentum rally. You can see how powerful the DMI-ADX is on the daily chart below compared to the weekly above. I suspect we will see the price consolidating along the way before $1,380 can be challenged. Volumes are strong, but they did taper slightly during this holiday week.

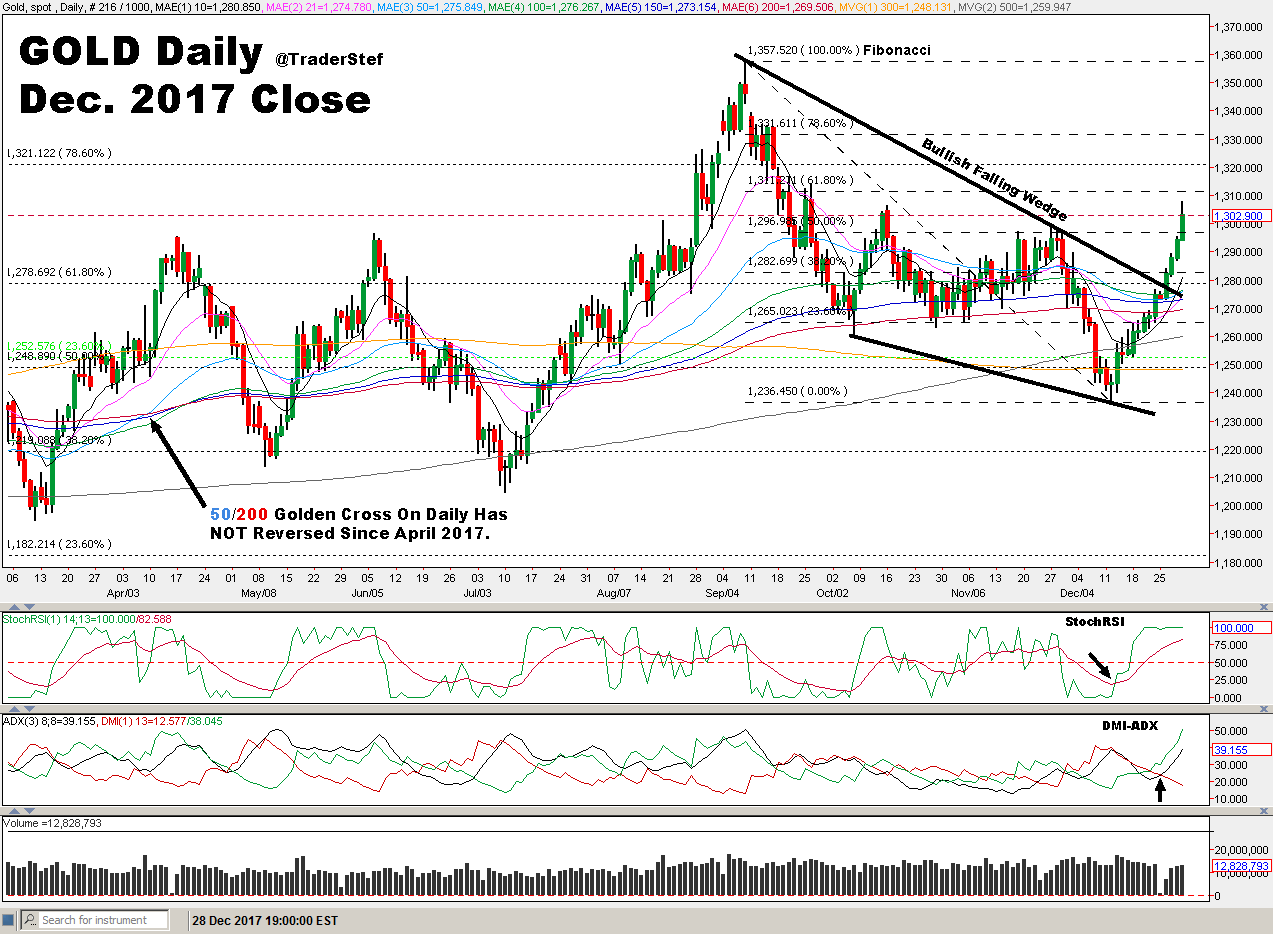
The most important bullish indicator on the daily chart, despite a few close encounters along the way, is the 50/200 EMA Golden Cross. It has not broken down since crossing over in April 2017. Second is the bullish Alligator Tongue set-up on the positive DMI-ADX since the price pierced the Falling Wedge and is indicative of powerful momentum. What more could you ask for in a healthy chart, despite interest rate hikes and delusions of >QT from the Fed? A Greenspan Put? There is nothing bearish about this chart. Take note that the $75 price action off the December pivot has not had a breather. The StochRSI is a bit stretched to an extended top, and we are crossing into the New Year. So, as noted on the weekly, I expect some chop and consolidation soon so that a bullish uptrend can continue onward. Slow and steady she goes.
—————-
USD weekly… The dollar is just bearish, with nothing looking positive. My call for tapping that lower trendline in the 90s if the 200 EMA was again violated is playing itself out. All studies are negative.

USD daily… The daily chart drives home the point of how bearish the dollar looks. The DMI-ADX is in the negative and has a strong Alligator Tongue set-up, indicative of a momentum move to downside. Note the little black arrow comparison to July-August of 2017 on the DMI-ADX study. The StochRSI has bottomed out, but the price could have a decent plunge before any bounce occurs while the RSI searches for a floor. The 50/200 EMA Death Cross that occurred in June 2017 continues, with all moving averages back above the current price action following the Dead Cat Bounce, which is very bearish.

Plan Your Trade, Trade Your Plan
TraderStef on Twitter
