Mathematics was never a strong point for me until my algebra and trigonometry teacher in high school clued me in on how to memorize formulas. If you are familiar with “Please Excuse My Dear Aunt Sally,” you know exactly where I am going with this. Mathematical formulas also determine how most technical analysis studies manifest on charts. If you were to ask me what the specific formula is for a particular study and how it does what it does, more often than not you will lose me.
Absorbing particular aspects of technical analysis became a lot easier when a trading mentor described a specific DMI-ADX setup as an “alligator tongue.” That is why it is never hyperlinked in any of my analyses and is just one example of many methods behind my technical analysis madness. If you want to study the underlying math and details for the DMI-ADX, invest in the book “ADXcellence – Power Trend Strategies” by Charles B. Schaap. The most effective method I use to memorize the plethora of setups across the technical analysis universe is the visual path. Note how the following image of an alligator with a snake as a tongue looks exactly like the most important power trend setup in ADXcellence. Keep that visual in mind when viewing my charts.

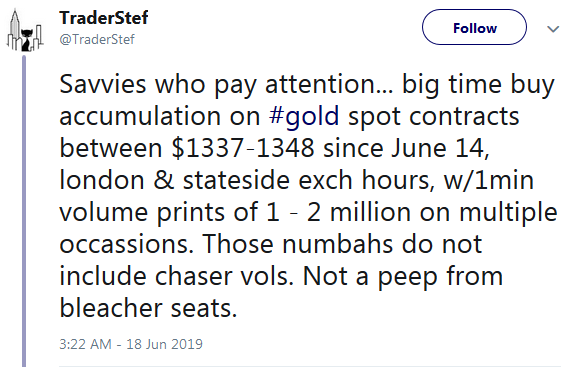
I posted several gold charts within two Twitter threads that begin on May 31 and Jun. 15. The following chart from Jun. 5 was indicative of major accumulation taking place and solidified the recent rally. To view a larger version of any chart, right-click on it and choose your “view image” option.


“FOMC. POWELL: THE CASE FOR ADDITIONAL ACCOMMODATION HAS STRENGTHENED” – Jun. 19, 2019

Excerpt from the Jun. 14 weekly chart analysis:

“The tightening end of the Ascending Triangle has developed a confluence of patterns due to the breakout and rally from the bullish Falling Wedge, which includes an Inverse Head ‘n Shoulders and a Cup ‘n Handle. The 500 Simple Moving Average (SMA) overhead continues to be a stubborn resistance level for all weekly candlesticks since Jan. 2019. The DMI-ADX is showing a bullish Alligator Tongue setup and the StochRSI has just arrived at an overbought level. The volume has risen along with the price over the past month and a slightly lower print was seen this week. Despite all the studies appearing bullish, a Long-Legged Doji candlestick closed out the week and is indicative of indecision. The daily chart will add more color to how bullish the price action is or isn’t.”
Gold weekly chart as of Jun. 20, 2019 6:30pm EDT…

The Fibonacci resistance level at $1,380 is now history after 5 years. Do not be shocked or whine if a pullback occurs and tests the resilience of support at $1,380. As I type this tonight, the price of gold traded at $1,412 in the Asian market. There is not much resistance for upside potential to where the price was in Apr. 2013. Here are the price levels to keep an eye on:
- $1,430 lateral from Aug. 2013
- $1,483 Fibonacci
- $1,530 lateral from Apr. 2013
- $1,586 Fibonacci
- $1,733 Fibonacci
- $1,920.74 Sep. 2011 high
Gold daily chart as of Jun. 20, 2019 5pm EDT,,,

Excerpt from the Jun. 14 analysis:
“After printing a high of $1,358.19 in London at around 3am EDT today, the USD rallied and profits were taken in gold until the end of the trading day in New York. Gold closed for the week at $1,341.58. All of the moving averages are lined up with the stars, the DMI-ADX shows positive momentum with an Alligator Tongue, and the volume has risen steadily along with a rising price… The daily and weekly closing candlesticks are both indecisive indicators, and a definitive near-term call cannot be made until the next business day and week play out. Overall, both charts are in the bullish camp.”
After the Aug. 2018 low in price, the following patterns played a significant role in gold’s rally to $1,400+:
- Ascending Scallop
- Ascending Triangle
- Cup ‘n Handle
- Falling Wedge
- Fibonacci
- Golden Cross
- Inverse Head ‘n Shoulders
- Measured Move Up
- Pennant Tilt
- Swiss Stairs
Today’s daily chart visual speaks for itself. It has been quite a run and I hope my analysis has helped with your investing and trading goals. For the record, nobody cares about silver until it breaches $21.50 with conviction.
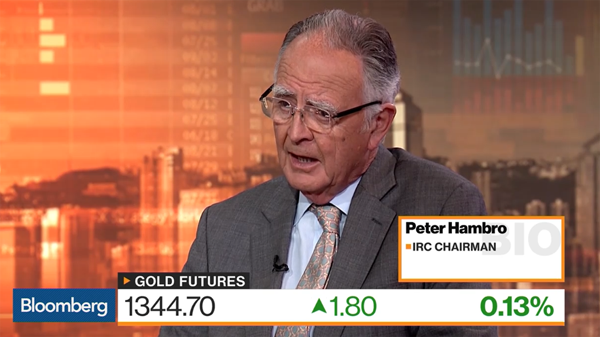
Peter Hambro Says Gold to ‘Move Up’ – Bloomberg, June 17
Plan Your Trade, Trade Your Plan
TraderStef on Twitter
Website: https://traderstef.wordpress.com


