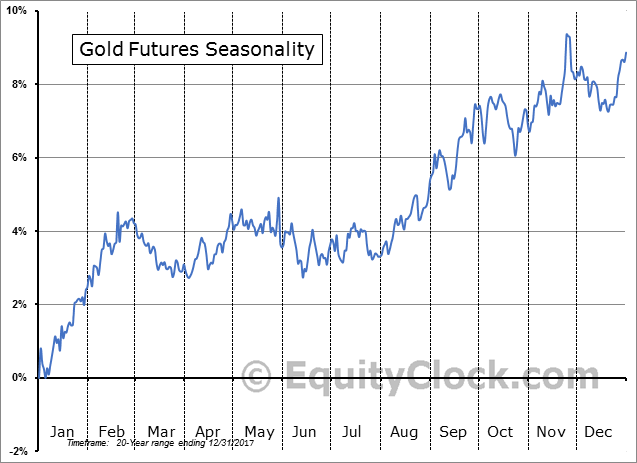
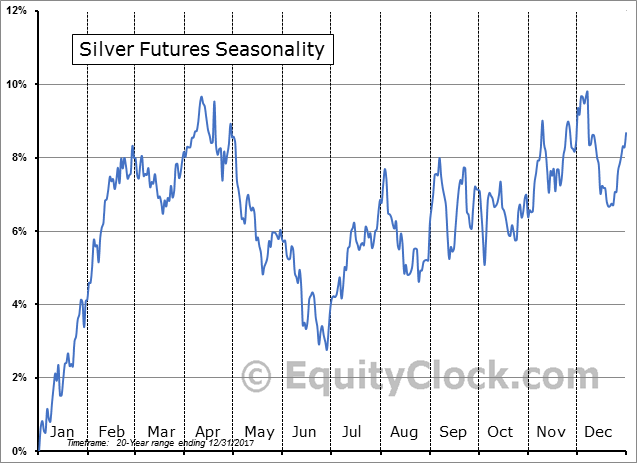
This will be a very busy week, with a plethora of economic data releases across the board. Many opportunities will arise for the markets to move around wildly at the whim of a headline. There are so many topics to choose from, but front and center is the Trade War bonanza. While chaos rules the news feeds, it is important to remain focused on your industry of choice. Regarding precious metals, they are approaching a seasonal cycle that begins around mid-March, when gold and silver routinely move to the upside before taking a breather in early to mid-spring.
Watching the gold price appear hamstrung at the same lateral price level for 5 years is frustrating for many, but building a solid foundation is more important for long-term and sustainable bull runs, instead of “get rich quick,” near-term Christmas tree charts. There are times when the cartel’s suppression footprints are obvious, but it does not occur as often as some may think. More often than not, the manipulation meme is a convenient excuse instead of recognizing market forces that do not move in your favor. The majority of mini-pukes are at price points where chart technicals are approaching an important confluence that portend a breakout to higher prices where cartel shorts would have major trouble pulling their pants back up because of a violent short squeeze swim. The professionals do not clown around, so any Johnny-come-latelys in the precious metals sector might consider the circus industry instead. The most successful traders tend to do due diligence and sharpen their skills by focusing on a specific sector. Being comfortable and proficient works wonders for the success department.
The Whack-a-Mole champ…
![]()
“A Very Busy Week”: A Look At Key Events In The Coming Days… “It’s a busy week with everything from politics (what’s next for Italy), central banks (the ECB and BOJ), China’s NPC, and US payrolls, where all eyes will be on the average hourly wages print, the catalyst that started the latest period of market volatility one month ago.” – ZeroHedge, Mar. 5
How Central Banks Actively Suppress The Price Of Gold – Jeffrey Snider, from Alhambra Investments – MacroVoices, Mar. 2 (interview won’t embed – begin at timestamp 14:45):
- Gold swaps and how central banks engage in them
- What has changed in gold swaps, and how are they done today?
- The gold bug’s conspiracy theory about “gold pukes” (aka mini-puke)
- What happened to gold in the 2008 crisis?
- What caused gold to turn at the end of 2008?
- Why do central banks still hold gold after 2008, and why are others not?
- Why did gold peak in 2011, and what was so bearish about it in 2013?
- How do dollar index futures fit into the gold story?
- How has the mood changed with gold starting in 2017?
- How will gold play out if the dollar continues to slide?
February 2018 Gold Chronicles with Jim Rickards and Alex Stanczyk – Physical Gold Fund, Feb. 20:
- How BLS jobs data is largely being misread by financial media
- Why all current narratives in financial media are missing true causes of early Feb. U.S. stock market corrections
- Why Atlanta Fed analysis is more of a nowcast than a forecast
- Why exploding sovereign debt and debt-to-GDP ratio are critical to market stability in next few years
- How student loans are a $1.5t problem, with a significant default rate
- What the two critical confidence boundaries are, and how they might be crossed
- 3-year playbook: not a forecast, but a potential scenario
Do Like JPMorgan’s Doing, Buy Silver?… “Roll in your Hunt Brother graves. Eat your still beating hearts Buffett, Munger, & Berkshire Hathaway.” – James Henry via ValueWalk, Feb. 16

In this episode of the Keiser Report, Max and Stacy discuss JP Morgan stacking silver – RT, Mar. 3
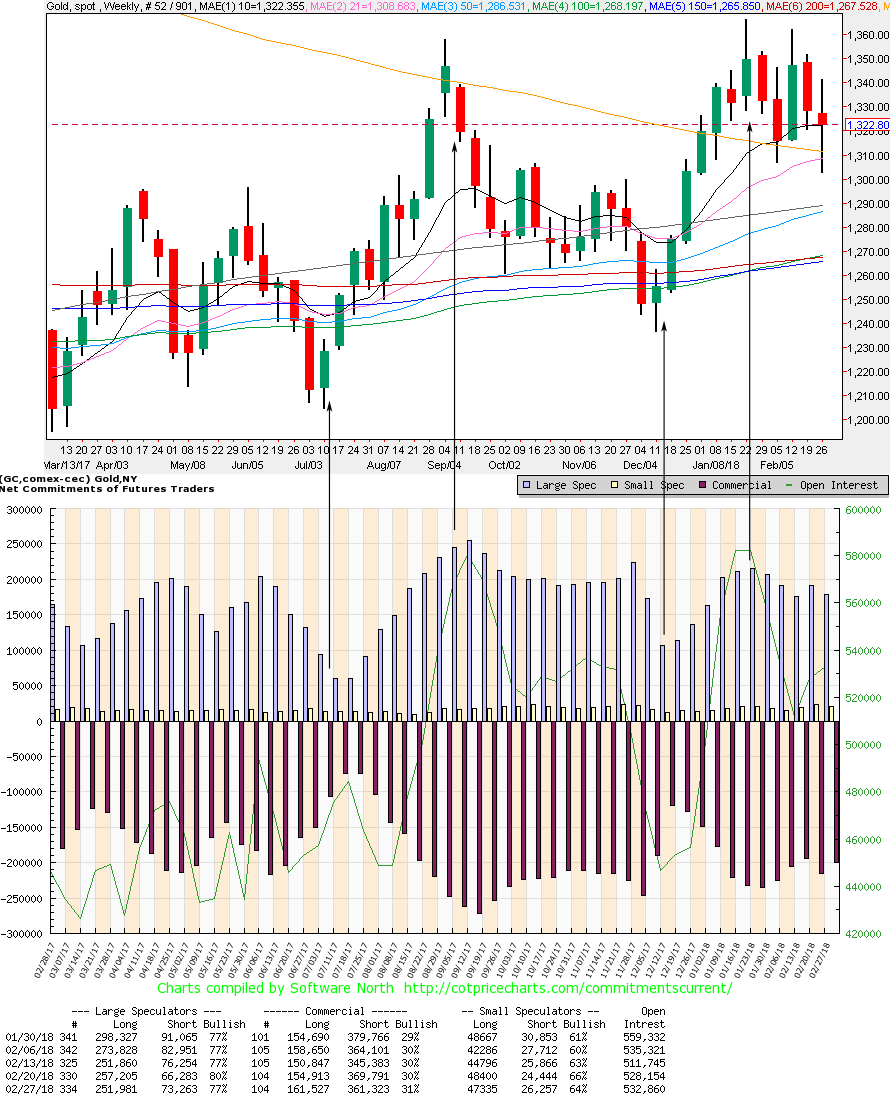
Silver Looks Way Better Than Gold Right Now… “Normally the action in the gold and silver futures markets tends to be pretty similar, since the same general forces affect both precious metals. When inflation or some other source of anxiety is ascendant, both metals rise, and vice versa. But lately – perhaps in a sign of how confused the world is becoming – gold and silver traders have diverged. Taking gold first, the speculators – who tend to be wrong at major inflection points – remain extremely bullish. Commercial traders, meanwhile – who tend to be right when speculators are wrong – are extremely bearish, with short positions more than double their longs. Historically that’s been a setup for a big drop in gold’s price.” – John Rubino, at Dollar Collapse, Mar. 3
When reviewing the Commitments of Traders report, silver does appear more primed for a move up in price than gold. But when doing their chart technical analysis, gold looks stronger. It’s quite a conundrum we have going on.


On to the gold and silver charts. As always, to view a larger version of any chart, right-click on it and choose your “view image” option.
Gold weekly, as of the Mar. 2nd close…

Gold is at status quo since the last analysis, with one pattern addition. There are no big moves to the upside or downside – only a consolidation chop just below the $1,380 ceiling, where a confluence of resistance has evolved for five long years. Let’s review the dominant patterns. Trendlines drawn down from 2013 and 2011 were breached, retested, and decisively taken out to the upside with volume. A bullish Inverse Head & Shoulders drawn back from 2013 has a Neckline slightly below a Fibonacci level of $1,380. The right shoulder has formed a bullish Cup & Handle. The right shoulder also had a successful, slanted Inverse Head & Shoulders pattern within the Cup. A bullish Golden Cross took place during Sep./Oct. 2017. All moving averages are back below the current price action and are spreading and turning upside. And lastly, new bullish Flagpole & Flag has formed since the Dec. 2017 pivot following the FOMC’s .25 interest rate piker. The DMI-ADX remains positive, though indecisive in direction. The StochRSI is beginning to roll over to the negative. Volumes have steadily increased since the low put in back in Dec. 2015, and each move upward in price is accompanied by rising volumes, and downward price moves are accompanied by falling volume. The volume patterns in relation to the Flagpole & Flag place an exclamation point on that observation. If the seasonal pattern of upward price moves remains true, a final test to punch through the overhead resistance at $1,380 is imminent. I remain Neutral near-term and Bullish long-term. Stay on your toes.
Silver weekly, as of the Mar. 2nd close…
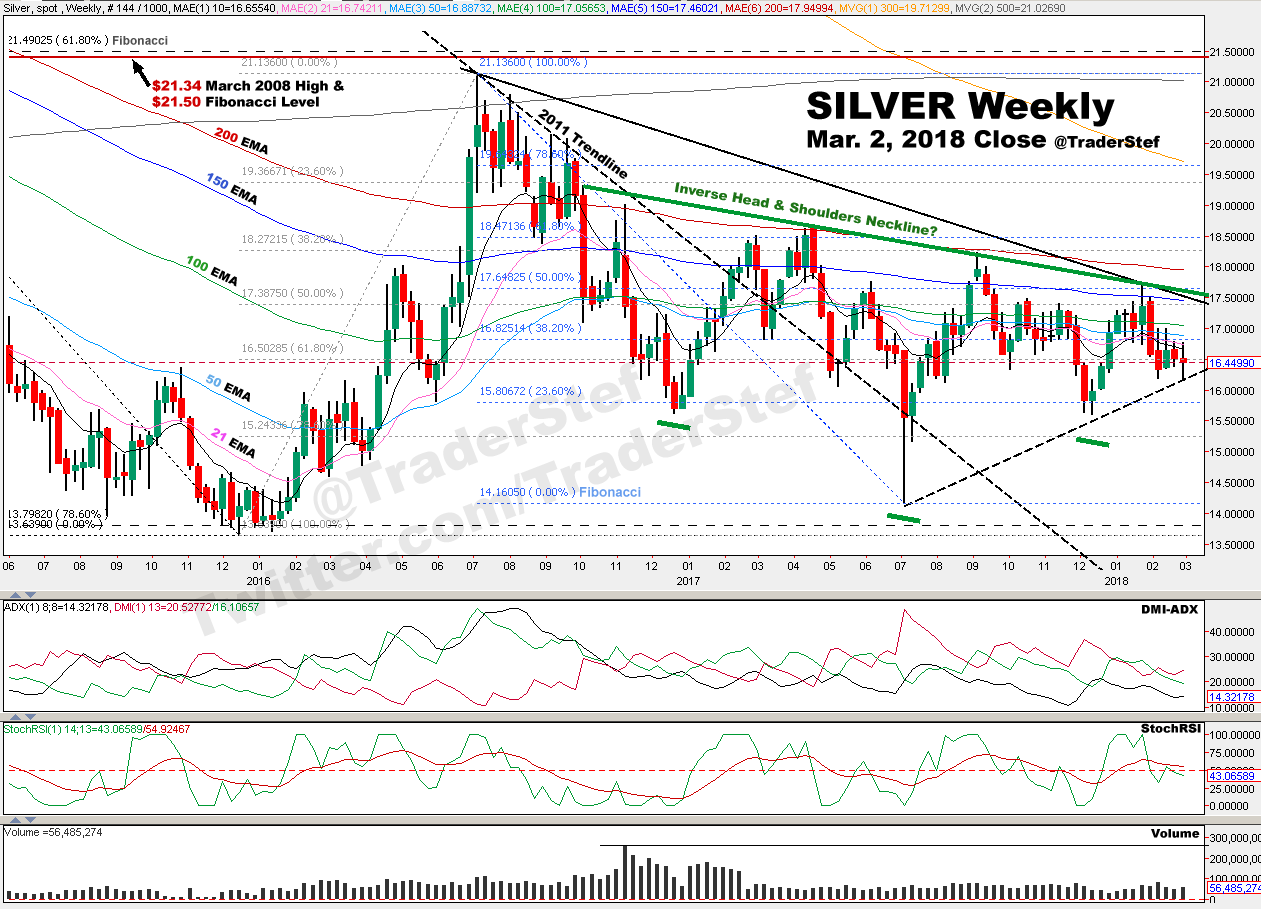
The Commitments of Traders report may be more bullish for silver than gold, but the silver price chart does not reflect that sentiment. None of the technical indicators add anything positive I did note one pattern that has evolved since the fall of 2016, an Inverse Head & Shoulders, but the current price action does not appear conducive in breaching the Neckline if the lower trendline drawn up from Jul. 2017 is breached to the downside. Once again, silver will only get its giddy-up going on when gold has a successful upside breach of its five-year resistance level. $21.50 is the most important number on the silver chart.
Plan Your Trade, Trade Your Plan
TraderStef on Twitter
Website: https://traderstef.wordpress.com