Traders are speculating on how to manage their capital after United States stock market indices had a dead-cat bounce this past summer, plunged through September, then rallied out of October. Fall’s relief rally is transitioning to end-of-year seasonality as recession signals and a liquidity crisis (Twitter thread) combine with Fedspeak that even confounds the seasoned professional.
Dow, Nasdaq, S&P, and Russell for Summer 2022… “Events transpiring around the world are growing nuttier, but Wall Street is having a summer party after a brutal plunge in major stock indices this year. It can be difficult to grasp which direction stock markets will run on any given day when bad news can be good news, automated platforms dominate trading volume and react to vocabulary and technical data without thinking, and human traders rarely accept the interrelated complexity of the world’s financial plumbing. The beauty of a price chart is that it’s the bottom line, indifferent to emotion, is often predictive when read accurately despite unforeseen news.” – TraderStef, Jul. 31
S&P 500 25-year average seasonality pattern…

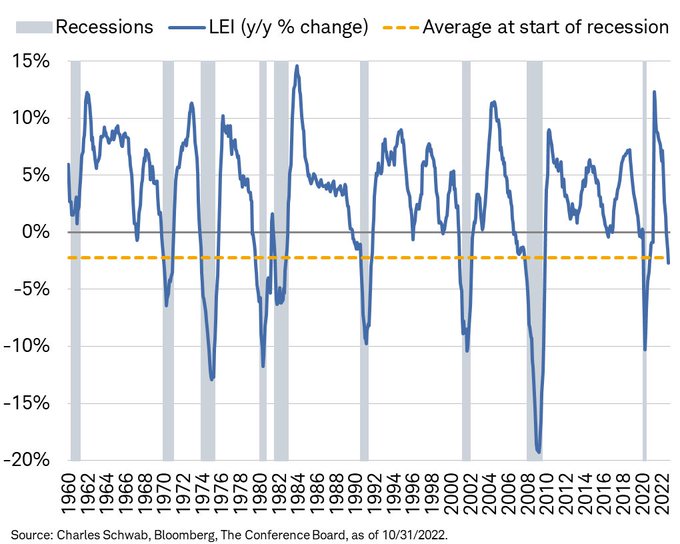
Leading Economic Indicators (LEI) via Liz Sonders – Oct. 31
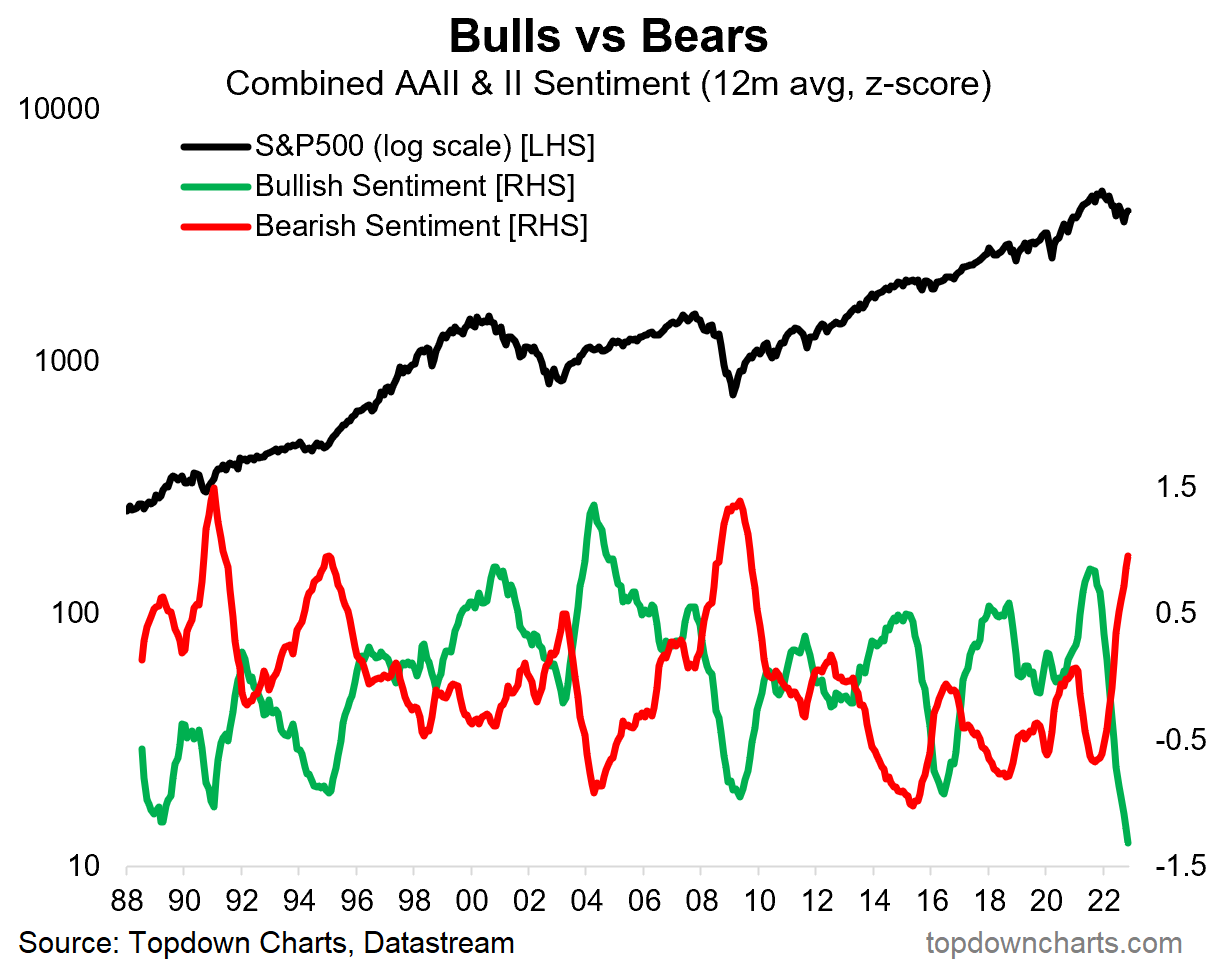
S&P 500 Bullish vs. Bearish Sentiment via ChartStorm – Nov. 20
“REAL-WORLD IMPACT OF FED RATE HIKES LIKELY HIGHER THAN WHAT CURRENT RATE TARGET IMPLIES – FINANCIAL MARKETS PRICED LIKE FED FUNDS RATE AT 6%, NOT 3.75%-4.00% – FED MUST BE MINDFUL OF RISK OF TIGHTENING POLICY TOO MUCH – DALY: FED MUST GET THE JOB DONE ON RATE HIKES BUT NOT OVERDO IT” – Fed’s Daly, Nov. 21
I highly recommend that you take time to review the late September interviews with Lacy Hunt and Stanley Druckenmiller at the end of today’s technical analysis commentary. Let’s go to the Dow, S&P 500, NASDAQ 100, and Russell 2000 charts and see what happened since the end of July. Keep in mind that if the Fed pauses and/or pivots to quantitative easing, stock markets and precious metals will rally until the global debt end-game plays out. To view a larger version of any chart below, right-click on it and choose the “view image” option.
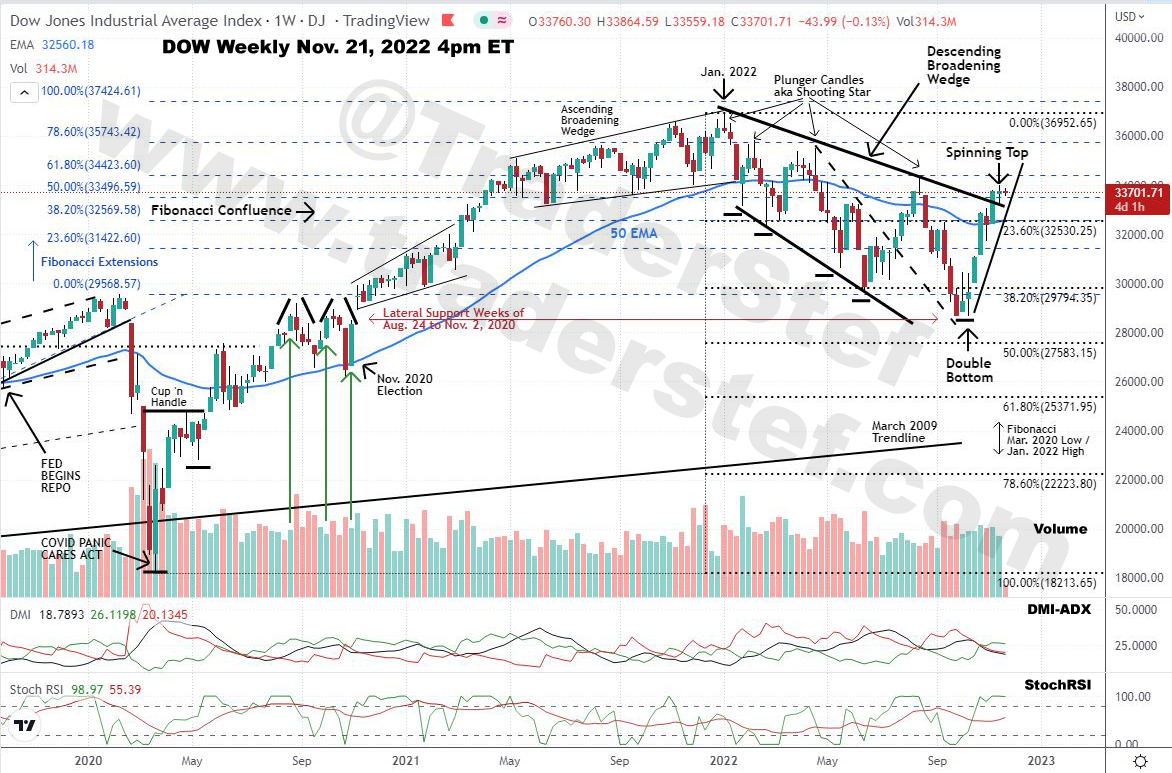
$DJI Dow Jones Industrial Index weekly chart as of Nov. 21, 2022, 4pm ET…
Excerpt from the July 31, 2022 weekly chart analysis:
“Dow has plunged 19.8% from its 36,953 high in Jan. 2022 to the 29,653 low in June and is just shy of 20%, which defines a bear market. The Dow closed at 32,845 on Friday. The rally in May was another Dead Cat Bounce that rolled over and completed a fourth stairstep down to the 38.2% Fibonacci level. That last step wiped out all the gains since Nov. 2020. The Descending Broadening Wedge drawn down from Jan. 2022 has a bullish Falling Wedge within it, and its topside trendline was taken out decisively over the last two weeks. The price action is approaching the overhead 50 Exponential Moving Average (EMA) that’s just above a Fibonacci Confluence and could rally to the topside trendline of the Descending Broadening Wedge if buy Volume continues to rise or remains steady. The DMI-ADX is in a potential transition to a bullish stance, the StochRSI is overbought but can still allow the price to rise further, and rising Volume with the rising price action is indicative of the strength of the trend. The strong pivot off the low is bullish, but caution is warranted until the 50 EMA and topside trendline of the Descending Broadening Wedge are taken out decisively. The chart is neutral and a scalping environment for professional traders.”
The Dow plunged 22.5% from its 36,953 high in Jan. 2022 to a 28,661 low in Oct. 2022. Last week’s price action printed a high of 33,987 and closed at 33,746 on a Spinning Top candlestick that’s indicative of indecision.
The summer rally briefly broke above the 50 EMA, but did not breach the Descending Broadening Wedge’s topside trendline after tapping it with a bearish Shooting Star (aka Plunger Candle). The subsequent correction from mid-August to the October low completed a fifth stairstep down and closed below the 38.2% Fibonacci level, but found support from August through November of 2020 and pivoted off a Double Bottom (view a daily chart). The current rally closed above the Descending Broadening Wedge’s topside trendline after taking out the 50 EMA and Fibonacci confluence two weeks ago. If the rally continues with steady buy Volume, the next resistance level is the mid-August Shooting Star with a 34,281 high.
The DMI-ADX is trending positive but indecisive, the StochRSI is overbought but the price action could still rise, and steady buy Volume with a rising price is indicative of uptrend strength since October. The rally was strong, but caution is warranted. The Fed’s December FOMC meeting is slated to announce a 0.50 basis point hike in the Federal Funds Rate (FFR) on Dec. 14 and release its bi-monthly summary of economic projections. A 0.50 vs. a 0.75 increase in the FFR might signal a slowdown in monetary policy tightening and prompt a stock market rally into the New Year. The chart is neutral and a scalping environment for professional traders.
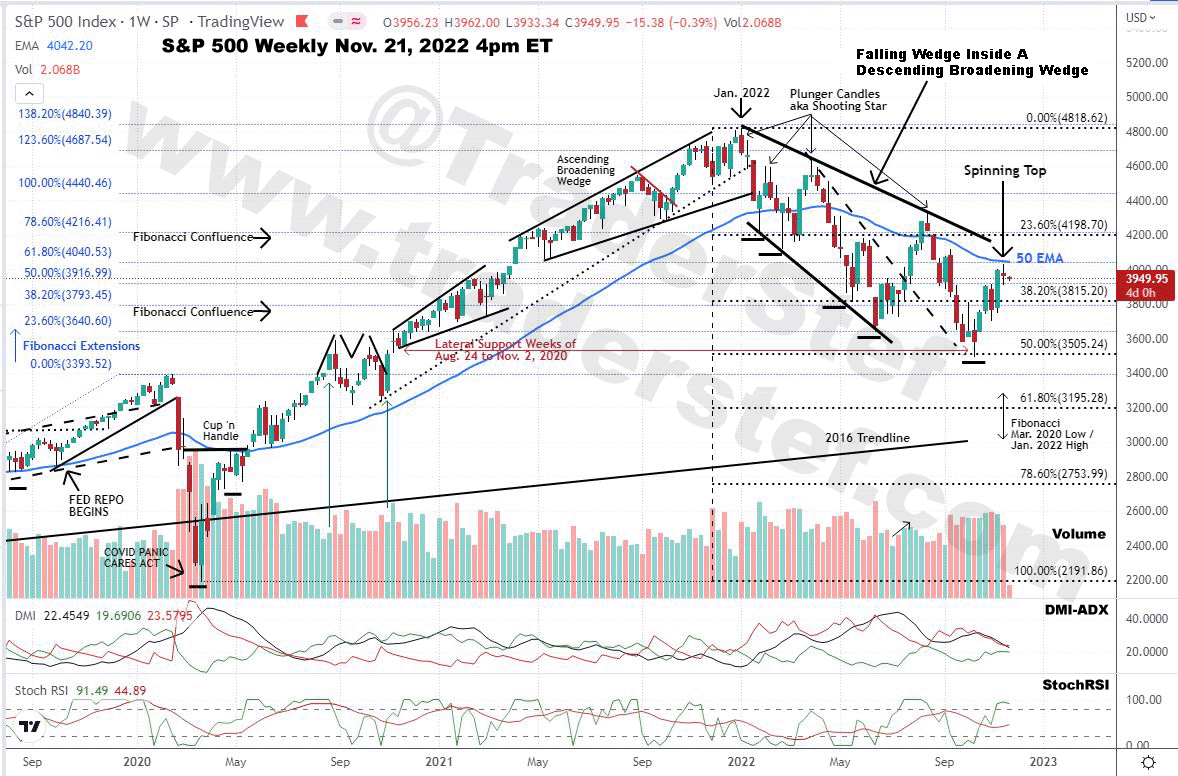
$SPX S&P 500 Index weekly chart as of Nov. 21, 2022, 4pm ET…
Excerpt from the July 31, 2022 weekly chart analysis:
“SPX has plunged 24.5% from its 4,819 high in Jan. 2022 to the 3,637 low in June, which placed the SPX in bear market territory and closed at 4,130 on Friday. The Dead Cat Bounce off the Jun. 2022 low rolled over and completed a fourth stairstep down that briefly fell below the 3,720 lateral support. That last step wiped out all the gains since late Dec. 2020. The price action is approaching the overhead 50 EMA that’s resting on a Fibonacci Confluence. Caution is warranted until the 50 EMA and topside trendline of the Descending Broadening Wedge are taken out decisively. The chart is neutral and a scalping environment for professional traders.”
The SPX has plunged 27.5% from its 4,819 high in Jan. 2022 to the 3,492 low in October. Last week printed a high of 4,029 and closed at 3,965 on a Spinning Top candlestick that’s indicative of indecision.
The summer rally briefly took out the overhead 50 EMA and tapped the Descending Broadening Wedge’s topside trendline with a bearish Plunger Candle. The subsequent low of 3,492 in October completed a fifth stairstep down to lateral support from August through November of 2020 and pivoted off the 50% Fibonacci level. The rally since mid-October failed to take out the overhead 50 EMA while printing a Spinning Top candlestick last week. If the rally continues with steady buy Volume, resistance stands at the 50 EMA, the Descending Broadening Wedge’s topside trendline, and 23.6% Fibonacci level that’s just shy of 4,200.
The DMI-ADX remains in a negative trend but indecisive, the StochRSI is overbought but the price action could still rise, and steady buy Volume with a rising price was indicative of uptrend strength until overhead resistance and selling halted the rally last week. The rally was strong, but caution is warranted. The chart is neutral and a scalping environment for professional traders.
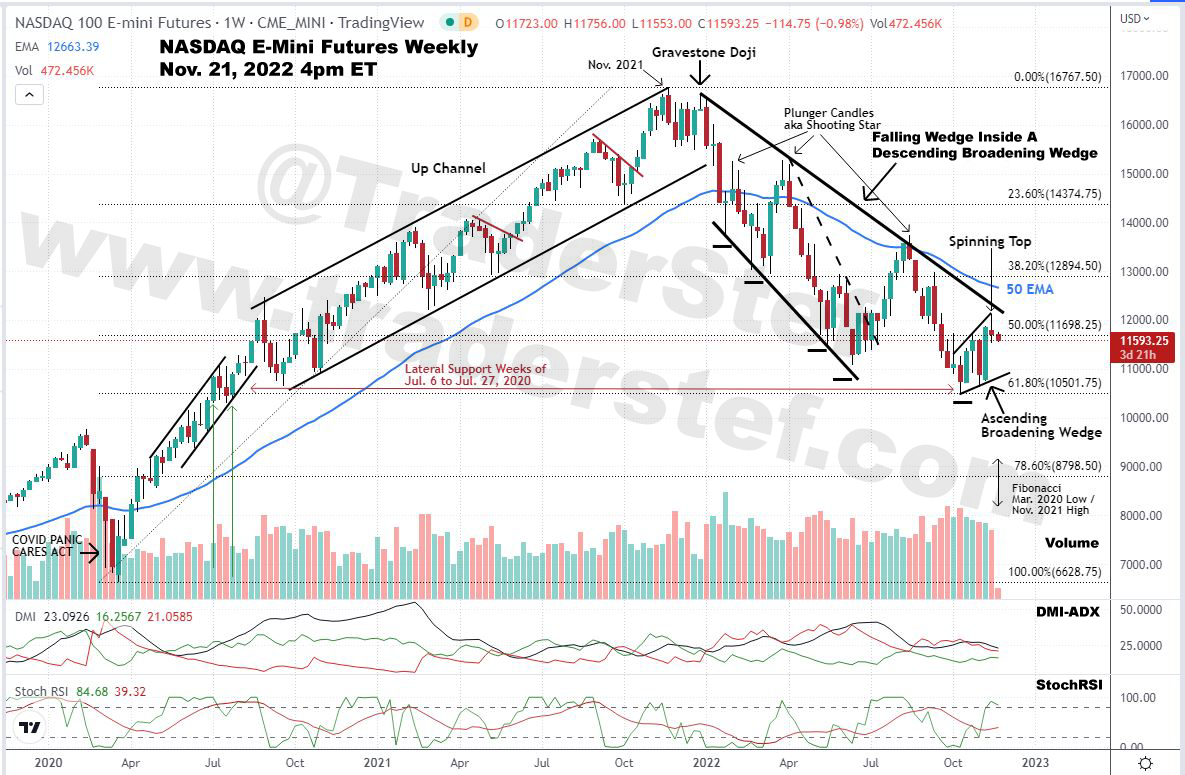
$NDX Nasdaq 100 E-Mini Futures weekly chart as of Nov. 21, 2022, 4pm ET…
Excerpt from the July 31, 2022 weekly chart analysis:
“NDX has plunged 34% from its 16,767 high in Nov. 2021 to the 11,068 low in Jun. 2022 and closed at 12,971 on Friday. The Dead Cat Bounce off the May 2022 low rolled over and completed a fourth stairstep down. That last step wiped out all the gains since Aug./Sep. 2020. The pivot off the low has stalled at the 38.2% Fibonacci level. Volume is steady but not trending upwards with the price. Caution is warranted until the 50 EMA and topside trendline of the Descending Broadening Wedge are taken out decisively. The next resistance level would be the 23.6% Fibonacci level at 14,375. The chart is neutral and a scalping environment for professional traders.”
The NDX has plunged 37.5% from its 16,767 high in Nov. 2021 to the 10,485 low in Oct. 2022. Last week’s price action printed a high of 12,119 and closed at 11,708 on a Spinning Top candlestick that’s indicative of indecision.
The summer rally was halted in mid-August by the overhead 50 EMA and the Descending Broadening Wedge’s topside trendline. The subsequent low in October completed a fifth stairstep down to lateral support from July 2020 and pivoted off the 61.8% Fibonacci level. The pivot has formed a bearish Ascending Broadening Wedge and the current rally has not yet reached the 50 EMA or topside trendline of the Descending Broadening Wedge.
The DMI-ADX remains in a negative trend but indecisive, the StochRSI is overbought but the price action could still rise, and steady buy Volume with a rising price was indicative of strength until selling halted the rally last week. The chart is neutral and a scalping environment for professional traders.
$RUT Russell 2000 E-Mini Futures weekly chart as of Nov. 21, 2022, 4pm ET…
Excerpt from the July 31, 2022 weekly chart analysis:
“RUT has plunged 34% from its 2,461 high in Nov. 2021 to the 1,641 low in Jun. 2022 and closed at 1,885 on Friday… a fourth stairstep down tapped 1,643. That last step wiped out all the gains since Nov. 2020. The price is trying to break above the topside trendline and 38.2% Fibonacci level. If successful, the 50 EMA is the next bus stop at around 1,970… The buy Volume is steady but trended downward last week. Caution is warranted until the 50 EMA is taken out decisively. The chart is neutral and a scalping environment for professional traders.”
RUT has not printed a lower low since mid-June and completed an Adam & Eve Double Bottom at the October low. The subsequent rally was halted over the last two weeks at the overhead 50 EMA resistance and 38.2% Fibonacci level. The DMI-ADX is indecisive, the StochRSI is overbought but the price action could still rise, and buy Volume has fallen after two weeks of strong selling. Caution is warranted until the 50 EMA is taken out decisively. The chart is neutral and a scalping environment for professional traders.
Lacy Hunt: ‘Worst Cost of Living Crisis Since 1980’ – Sep. 25 (12:05 – 38:25)
Stanley Druckenmiller on CNBC‘s Delivering Alpha – Sep. 28
Plan Your Trade, Trade Your Plan
TraderStef on Twitter, Gettr / Website: TraderStef.com


