
Two business days after publishing a bearish late fall analysis on Oct. 29 and one day following “The Federal Reserve at War” penned by Judy Shelton for the Wall Street Journal, an FOMC monetary policy announcement on Nov. 1 was dovish enough to launch a wicked rally to remember where “everyone got burned.”
Dow jumps more than 550 points for best day since June as bond yields recede… “Data released Thursday morning showed easing inflation and a slowing labor market, adding to investor confidence that the Federal Reserve could be done raising rates… Stocks gained Thursday as Treasury yields fell, with investors betting the Federal Reserve could be done raising rates for 2023.” – CNBC, Nov. 2
“Bets that the Fed is done raising rates have surged this morning after Powell hinted the Fed is done with hikes. Odds for a December pause now stand at 85%, up from 80% yesterday.” – Jesse Cohen, Nov. 2
With officialdom’s narrative of winning the war on inflation at 3% instead of a “transitory” 9% during mid-2022, the Fed pausing interest rate hikes since mid-summer while vomiting bipolar Fedspeak for months, politicos on Capitol Hill kicking the proverbial U.S. national debt can down the road via continuing resolutions to avoid government shutdowns and risking a technical sovereign debt default or further cuts to the U.S. credit rating, capital in Europe seeking safety from NATO’s “meat grinder” proxy war with Russia on Ukraine’s black soil, another war that launched in October between Israel and Hamas that’s slowly morphing into a regional Middle East war, and the “magnificent seven” hopium that hitched another ride on the artificial intelligence (A.I.) utopia train that’s levitating stock market indices, it’s no wonder retail plebes and institutional investment firms were confused about whether to enter or exit the fray amid short squeeze hell or be fashionably late to the poker party.
- Forget the S&P 500. Pay attention to the S&P 493 – The Economist, Nov. 8, 2023

Magnificent Seven vs. S&P 493 – The Economist
Fed Chairman Jay Powell added more fuel to the rally when he delivered more dovishness on Dec. 1:
Spot Gold Rises to Record on Dovish Fed Remarks… “The latest leg of gold’s rally has been turbocharged by comments on Friday from Fed Chair Jerome Powell that traders interpreted as setting the stage for a pivot toward rate cuts, spurring a plunge in the dollar and Treasury yields.” – Bloomberg, Dec. 4
A caveat in the “irrational exuberance” soup is the Bidenomics bullshit as the U.S. economy and many Western allies suffer from a serious bout of “economic deterioration” and have already entered recession. Reality no longer exists until humans wake up from our financialized economy where algos and A.I.-automated stock markets dominate trading. Unfortunately, we may be trending beyond the #TaperCaper and accelerating toward a global debt endgame where shunning the U.S. dollar through de-dollarization and its sovereign debt instruments quicken. Consider the following excerpt from my late fall analysis:
“Keep in mind that if and when the Fed returns to full-blown quantitative easing (QE) or another dovish mode as the latest Taper Caper unfolds, liquidity injected into the recessionary West could rally stock markets until the global debt endgame plays out. The next FOMC monetary policy announcement is slated for next week.” – TraderStef, Oct. 29
On Dec. 13, the FOMC delivered a “Fed pivot” to the markets that included a new dot plot graph that forecasts the slashing of interest rates next year and murmurings about recession in 2024. Any reference to it just being “dovish” is an understatement. The Dow was first in line to surge to record highs while Treasury yields and the dollar plunged further.
The Fed Pencils in 2-3 Rate Cuts in 2024, the Market Expects 4-5… “The bonds and stock markets are both cheering. The 10-year yield is down significantly over 17 basis points (0.17 percentage points) as I type… Hopium is alive. It’s possible the Fed will cut even more than expected. But if so, will it be for strong economic reasons, a collapse in economic activity, or a surge of banking failures? If inflation is transitory, then transitory to what?” – MishTalk, Dec. 13
‘Everyone Got Burned’: Wall Street Missed the Great Stock Rally of 2023… “What was supposed to go up went down, or listed sideways, and what was supposed to go down went up — and up and up. The S&P 500 climbed more than 20% and the Nasdaq 100 soared over 50%, the biggest annual gain since the go-go days of the dot-com boom.” – Bloomberg, Dec. 28
Financial pundits are in high-octane mode with predictions for the S&P 500 in 2024 that range from 4,300 to 5,200.

Let’s move on to the Dow, S&P 500, Nasdaq 100, and Russell 2000 charts to see what’s happened since late October. Note that a technical analysis with a weekly candlestick chart focuses on potential near-term (a few weeks) trading opportunities for short-term swings or intraday scalps. To view a larger version of any chart below, mouse over it and select or right-click it and choose a “view image” option.

$DJI Dow Jones Industrial Index vs. USD weekly chart Dec. 2023 close…

Excerpt from the Oct. 27, 2023 (Twitter thread) weekly chart analysis:
“The Dow printed a 36,953 high in Jan. 2022 and plunged 22.5% to the 28,661 low in Oct. 2022, then rallied to a high of 35,679 in Jul. 2023 and printed a low of 32,327 this past Friday, which is -14% off the 2022 high. I emphasized in August to keep a close eye on the red trendlines drawn up from the fall 2022 Adam & Adam Double Bottom. The downside price action already breached the 50 Exponential Moving Average (EMA), closed at the 23.6% Fibonacci on Friday, and is threatening a plunge to the mid-March low… It is possible the Dow plunges to the next Fibonacci level at around 29,500-29,800. That kind of move eliminates all gains made since the 1Q20 pre-pandemic high. The DMI-ADX is on the verge of a negative power trend setup, and sell Volumes have been steady with a falling price. The chart is bearish.”
As noted earlier, the dovish FOMC announcement on Nov. 1 launched the current rally after printing a low of 32,327 on Oct. 27. The subsequent price action breached the 50 EMA, the trendline drawn down from Jan. 2022 and summer of 2023, then the 35,679 lateral resistance and left them all in the dust. The Fed Pivot on Dec. 13 turbocharged the rally with a spike above the Jan. 2022 all-time high and printed a 37,779 high this past week that’s just shy of a 17% gain over 9 weeks. The Dow closed for the week at 37,690.
The Dow is in blue sky territory with no price history to identify resistance. I included a few Fibonacci Extensions on the chart that provide levels to keep an eye on if the rally extends into 2024. The next upside target is the 23.6% Fibonacci at 38,909. Support rests around the 35,679 lateral. The DMI-ADX is in a bullish Alligator Tongue power trend but hesitating while it digests the recent price spike into all-time high territory. The price is extended well above the 50 EMA, and buy Volume has fallen for the last three weeks. There could be some profit-taking and a breather on the horizon. The chart is bullish, and caution is warranted in the near term.
$SPX S&P 500 Index vs. USD weekly chart Dec. 2023 close…

Excerpt from the Oct. 27, 2023 weekly chart analysis:
“The S&P 500 printed a 4,819 high in Jan. 2022 and plunged 26.5% to the 3,492 low in Oct. 2022, then rallied to a high of 4,607 in Jul. 2023 and printed a low of 4,104 this past Friday, which is -15% off the 2022 high. The price action in late August was a Dead Cat Bounce, and the rising sell Volume forced a price fall to the 50 EMA. There were three weeks of consolidation before the 50 EMA, a Fibonacci level, and lower trendline of the Up Channel were breached to the downside. The next levels of support are the Mar. 2020 trendline and 38.2% Fibonacci… If selling continues beyond those levels, the S&P could face the same fate as the Dow if all gains since the 1Q20 highs are wiped out. That level is 3,400-3,500 for the S&P. The DMI-ADX is on the verge of a negative power trend setup, and sell Volumes are rising with a falling price. The chart is bearish.”
The rally is just as prominent and extended on the S&P, but the price action has not breached the Jan. 2022 high of 4,819. Since printing a 4,104 low in late October, the price spiked to a high of 4,793 this past week and is just shy of a 16.5% gain over 9 weeks. This week’s Plunger Candle at the close signals the potential for a pullback. Support is around the 4,607 lateral. The S&P closed for the week at 4,770.
The DMI-ADX is in a bullish Alligator Tongue power trend but hesitating while it digests the recent price spike that’s extended well above the 50 EMA, and buy Volume has fallen for the last three weeks. There could be profit-taking and a breather on the horizon. The chart is bullish, and caution is warranted in the near term.
$NDQ Nasdaq 100 E-Mini Futures ($NQ1) weekly chart Dec. 2023 close…
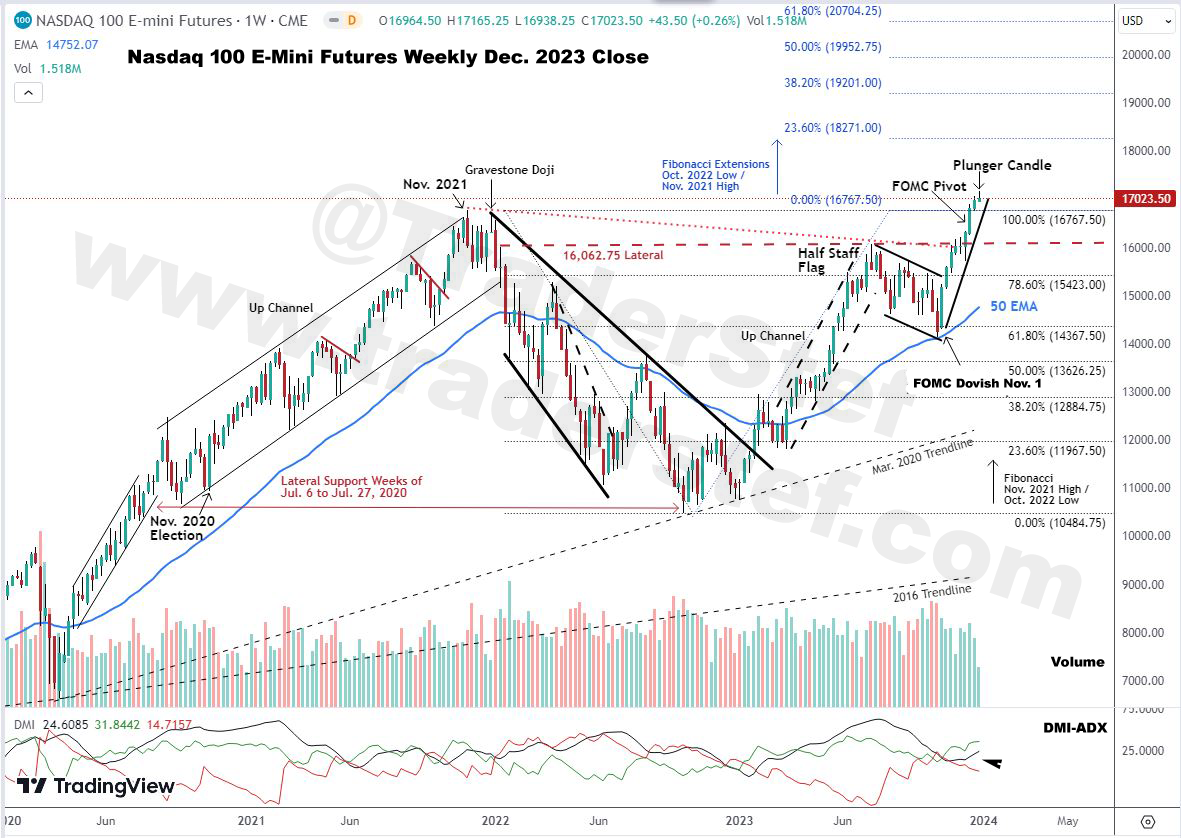
Excerpt from the Oct. 27, 2023 weekly chart analysis:
“The Nasdaq printed a 16,767 high in Nov. 2021 and plunged 37.5% to the 10,485 low in Oct. 2022, then rallied to a high of 4,607 in Jul. 2023 and printed a low of 14,140 this past Friday, which is -15.5% off the 2021 high. The price action since mid-August has chopped downward… A bullish Half Staff Flag has formed since the mid-July high, but I am not convinced a significant rally leaves it behind… sell Volume has risen while the price is falling, and the DMI-ADX is indecisive but leaning negative. The chart is neutral.”
The bullish Half Staff Flag was confirmed in this rally since the 16,063 lateral and trendline drawn down from the 2021 high were decisively taken out. The subsequent price spike printed an all-time high of 17,165 this past week, which is just shy of a 21.5% gain over 9 weeks from the 14,140 low in late October. This week’s Plunger Candle at the close signals the potential for a pullback. Support is around the 16,063 lateral and trendline drawn down from the Nov. 2021 high. The Nasdaq futures closed for the week at 17,023.
The DMI-ADX is in the early stage of a bullish Alligator Tongue power trend but hesitating while it digests the recent price spike that’s extended well above the 50 EMA. Buy Volume remains strong and was much lower over the past week. There could be profit-taking and a breather on the horizon. The chart is bullish, and caution is warranted in the near term.
$RUT Russell 2000 E-Mini Futures ($RTY) weekly chart Dec. 2023 close…

Excerpt from the Oct. 27, 2023 weekly chart analysis:
“The Russell printed a 2,461 high in Nov. 2021 and plunged 37.5% to the 1,641 low in Jun. 2022, then rallied to a high of 2,033 in Aug. 2022 and printed a low of 1,639 this past Friday, which is -33% off the 2022 high… If the 1,640 lateral is taken out and the price action plunges, a Measured Move Down pattern is confirmed. The current level has a lot of support going back to mid-2018, but the chart is bearish.”
Price action on the Russel is nowhere near its all-time high of 2,461, but the rally from the late October low of 1,639 to the 2,097 high printed this past week is a 28% gain over 9 weeks. This week’s bearish Gravestone Doji (aka Plunger Candle) at the close signals a high potential for a pullback. Support is around the 2,000 lateral, 38.2% Fibonacci, and trendline drawn down from the Nov. 2021 high. There could be additional profit taking and a breather on the horizon. The Russell futures closed for the week at 2,048.
The DMI-ADX is in a bullish Alligator Tongue power trend but hesitating while it digests the recent price spike that’s extended well above the 50 EMA. Buy Volume remained strong until this past week, which printed a sell Volume bar. The chart is neutral, and caution is warranted in the near term.
DoubleLine’s Gundlach: 10-year Treasury yield will fall to 3% next year – CNBC, Dec. 14
Plan Your Trade, Trade Your Plan
TraderStef on Twitter, Gettr / Website: TraderStef.com
