
While mainstream media is stuck on Trump’s ongoing soap opera that distracts from President Biden and Hunter’s documented money laundering business for political favor and Ukraine’s counteroffensive war that’s thus far a disaster in Russia’s favor, the recession shark is biding its time before taking the first bite out of Goldilocks’ hopium. Maybe you’re caught up in a return of “irrational exuberance” and suffer from FOMO while digesting the recent stock market rally in technology sector equities and lopsided weighted indices due to a Borg-chasing artificial intelligence freakshow when only the Russell 2000 index appears to be keeping its feet firmly planted in valuation reality. The last time I checked, microchip and memory demand are primarily driven by consumer gadgetry that remains weak, and PC demand is cratering. The Wall Street Journal handed Biden a bullhorn opportunity last week to disseminate his fantasy on how the current state of the United States economy provides plebians with “breathing room.” He correctly stated that an economy can take punches and bounce back but erroneously tied certain economic reports to what his administration views as a great achievement. Before venturing any further into the bear’s porridge, here’s an excerpt from Part 2 (Twitter thread) published in April:
“The recession’s hard-landing arrival is a slow trainwreck with roots dating back to the spring of 2022 when the United States gross domestic product (GDP) printed two consecutive quarters of negative growth. Goldilocks’ pundits would have you believe that the economy’s plumbing is more akin to an event rather than a series of financial, political, and economic factors that build and eventually converge with lagging indicators in hindsight. A seasoned investor or trader recognizes patterns that lead to ultimate turning points and practice risk management to hedge a threat and mitigate a ‘deer in the headlights’ moment with a goal to secure existing capital to realize profit opportunities as the population at large sulks over the monetary damage and ignores retirement account statements for months through a financial crisis.” – TraderStef
The current White House clown show has a habit of redefining dictionary terminology, geopolitical diplomacy, and inverts scientific and financial reality. A case in point is the definition of a recession. A widely known rule of thumb among economic gormandizers is that two consecutive quarters of negative GDP growth indicate a recession has started and is often referred to as a technical recession. Despite decades of assessment and usage, the Biden administration said it’s your imagination after two consecutive quarters of negative GDP in mid-2022.
How Do Economists Determine Whether the Economy Is in a Recession?… “What is a recession? While some maintain that two consecutive quarters of falling real GDP constitute a recession, that is neither the official definition nor the way economists evaluate the state of the business cycle. The National Bureau of Economic Research (NBER) Business Cycle Dating Committee—the official recession scorekeeper—defines a recession as ‘a significant decline in economic activity that is spread across the economy and that lasts more than a few months.’” – White House, Jul. 2022
So true to Orwell, Team Biden is going to change the meaning of words… “Biden’s Council of Economic Advisors launched a preemptive strike against bad news with a blog post on the theme: ‘What is a recession?’ Despite decades of top economists concurring on a definition, Biden’s appointees treat the topic like an arcane metaphysical dispute that requires a ‘holistic look at the data.’ Instead of admitting the economy is shrinking, Team Biden touts a test indicating that a recession is not underway unless ‘the three-month moving average of the unemployment rate rises by at least half a percentage point (50 basis points) relative to its lowest point in the previous 12 months.’” – New York Post, Jul. 2022
Deutsche Bank says the U.S. is headed for a ‘policy led’ recession—it’s the unavoidable ‘boom-bust cycle’… “In April of last year, just a month after Russia’s invasion of Ukraine, Deutsche Bank became the first major investment bank to predict a U.S. recession. Less than a month later, its economists upped the ante on their forecast, arguing that a “major recession” would hit by the end of 2023 or the first quarter of 2024 due to rising interest rates and stubborn inflation.” – Fortune, May 2023
Meanwhile, Europe’s economic powerhouse is breaking down with consequences for all of the European Union, Australia entered a “retail recession” as inflation and interest rate hikes hit spending, Japan’s recession is imminent, and the UK is slated for recession this year despite a recent growth spurt. Germany announced in late May that it fell into recession in early 2023 with persistent inflation pressures, and the Eurozone admitted it’s in a recession last week. The 20-country GDP has been contracting since 4Q22 since growth was zero-bound for two consecutive quarters.
“Data from statistics agency Eurostat show signs that central bank interest rate hikes will crimp the region’s future growth prospects… ‘Domestic demand is not in a good place,’ Oxford Economics’ analysts said in a note, adding first-quarter public spending saw the largest contraction on record except for during the first wave of coronavirus lockdowns in 2020. ‘Going forward, growth will remain soft despite dropping wholesale energy prices, as monetary policy tightening dents investment and still-present inflationary pressures constrain consumption.’”
Goldilocks in the U.S.:
“One of the worst, if not the worst, data series from a rate of change standpoint is actually Jobless Claims. The next worst is Retail Sales.” – @Hedgeye, Jun. 16
Labor demand shows signs of softening, and the increase in layoffs has broken out of its recent range. Biden claims the U.S. economy created 13 million jobs since he took office, but reality dictates a majority of those jobs were folks returning to work following an unprecedented pandemic lockdown. Initial unemployment claims jumped last week to 262k from 233k, and the 4-week moving average at 246,750 is the highest since Nov. 2021. Continuing claims also moved higher to 1.775m. The unemployment rate jumped from 3.4% to 3.7% in May and is the highest since Oct. 2021. With gains concentrated in only a few industries, we’re losing well-paid, full-time jobs in technology and business services that are being replaced by lower-paid, part-time jobs in the leisure and hospitality sectors. Elevated layoff announcements are pointing to unemployment claims grinding higher through the rest of this year, and labor productivity has been trending in negative territory YoY since 4Q21. To reach the midpoint of the FOMC projections for 4Q23, the economy will likely have to shed 1 million jobs.


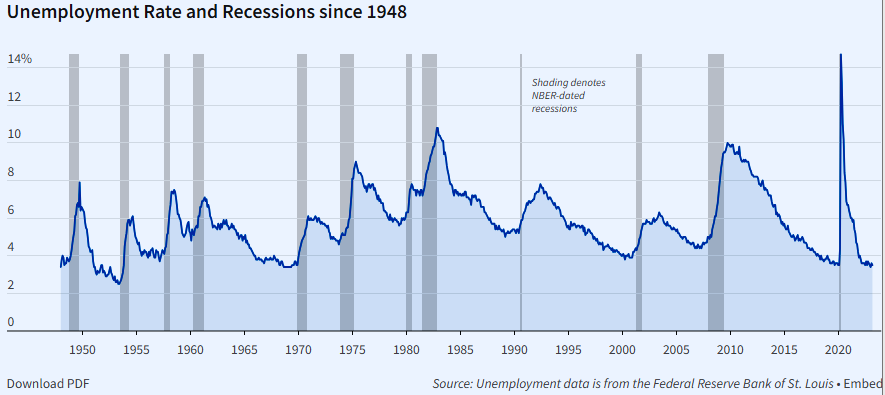
Unemployment Rate and Recessions Since 1948 – NBER
The spike in credit card delinquency rates is fast approaching 2008 levels across all age categories for consumers. It’s no wonder retail sales surprise to the upside month-on-month occasionally when the plebes max out credit cards as their pandemic savings disappear, and that’s reflected in Redbook’s YoY same-store retail sales collapse. Meanwhile, upscale retailers and discounters are slashing forecasts.


Redbook Minus CPI is -4.3% YoY – Alejandro Scórpio

With roughly 70% of GDP associated with consumer spending, its dramatic decline in 1Q23 with higher interest rates hammering the housing market was indicative of economic contraction. Note that real GDP has been in decline since the early 1980s (without the pandemic panic spikes). The BEA reported that real GDP increased at a 1.3% annual rate in 1Q23, and estimates suggest 2Q23 GDP will be in the 1% to 2% range.
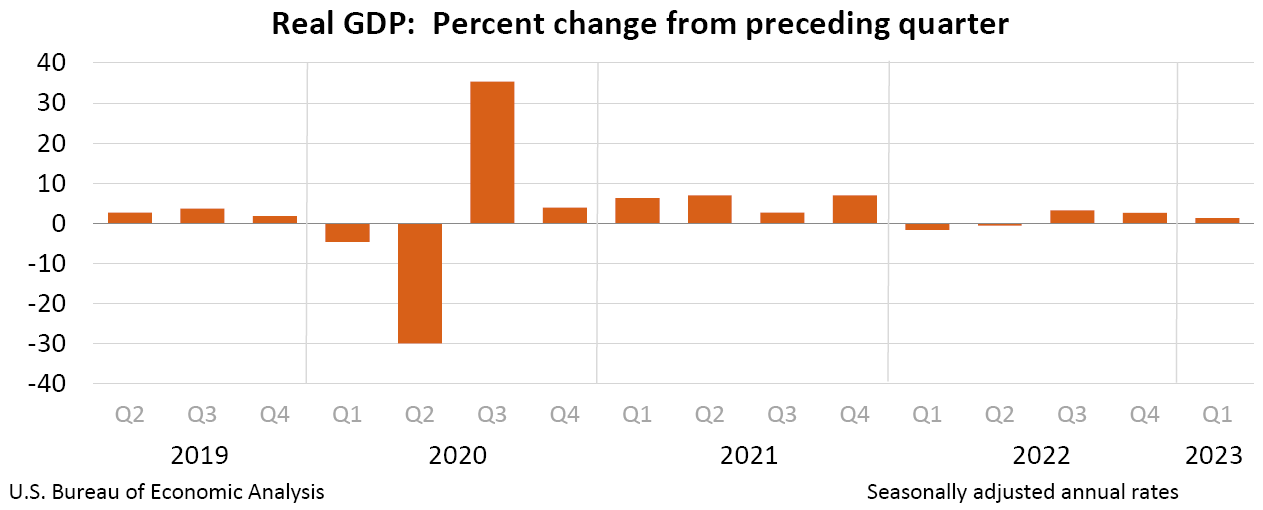

Real Gross Domestic Product (GDP) 1949-1Q23 – FRED, St. Louis Fed
The latest estimate for 2Q23’s Real GDP via the Atlanta Fed GDPNow is 1.8% as of Jun. 15 and other forecasts expect the final print to be negative. The next GDPNow update will be released on Jun. 20.
“The GDPNow model estimate for real GDP growth (seasonally adjusted annual rate) in the second quarter of 2023 is 1.8% on June 15, down from 2.2% on June 8. After recent releases from the US Bureau of Labor Statistics, the US Census Bureau, the Federal Reserve Board of Governors, and the US Department of the Treasury’s Bureau of the Fiscal Service, the nowcasts of 2Q23 real personal consumption expenditures growth and real government spending growth decreased from 1.4% and 2.7%, respectively, to 0.9% and 2.3%.”

Housing affordability is near its lowest level since 1986 and will weigh on home sales for the remainder of the year. The Case-Shiller top city home prices declined YoY for the first time since May 2012. Note in the following video that bankruptcies across the economy are on the rise. The next shoe to drop is the commercial real estate (thread) sector.
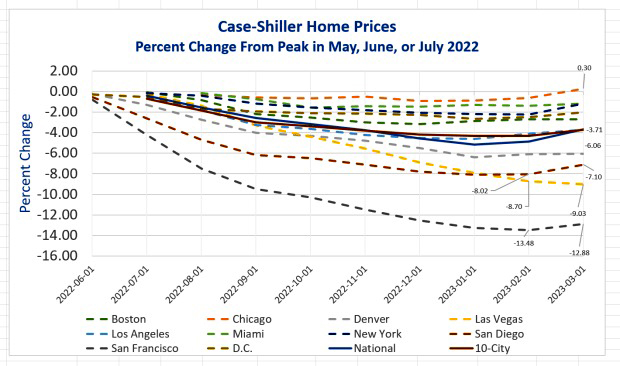
“Demand shows 62% of Americans who purchased homes in 2022 and 2023 are not managing to make their mortgage payments. Add on an average $393 per month for 40 million Americans in that same millennial cohort that is recently becoming homebuyers.” – Danielle DiMartino Booth, Jun. 6 (CNBC video)
As real wages have failed to keep up with inflation for 26 straight months, Biden touts that gasoline prices are down $1.40 (by draining 50% of the U.S. Strategic Petroleum Reserve, which is now at its lowest level since 1983) from their Jun. 2022 peak but are still up significantly after he gave away U.S. energy independence the day he stepped foot in the White House. Inflation has declined for 10 months straight, but core inflation is still at about 5%, and he’s oblivious to the fact that printing $5 trillion for everyone raised prices on everything amid a supply chain crisis.

Accelerating disinflation is the Federal Reserve’s greatest fear, and the FOMC pulled out the #TaperCaper card when it “paused” interest rate hikes this week. Jay Powell hinted at the potential for two additional rate hikes in 2023 and expects to begin cutting rates sometime in 2024. One of the Fed’s favorite data points is the leading economic index (LEI), which is a gauge of 10 indicators designed to show whether the economy is getting better or worse. The LEI fell 0.6% in April and declined for the 13th month in a row, which points to a recession later in the year. Another Fed favorite is the producer price index (PPI) which measures inflation at the wholesale level compiled from thousands of indices for domestic producer output. PPI is not the same as the Consumer Price Index (CPI), which measures the change in price of goods and services paid by consumers. May 2023 headline PPI inflation fell to +1.1% vs. +1.5% est. and +2.3% prior, which is the lowest reading since Dec. 2020, and core PPI less food and energy printed +2.8% vs. +2.9% est. and +3.2% prior, which is the lowest since Feb. 2021.
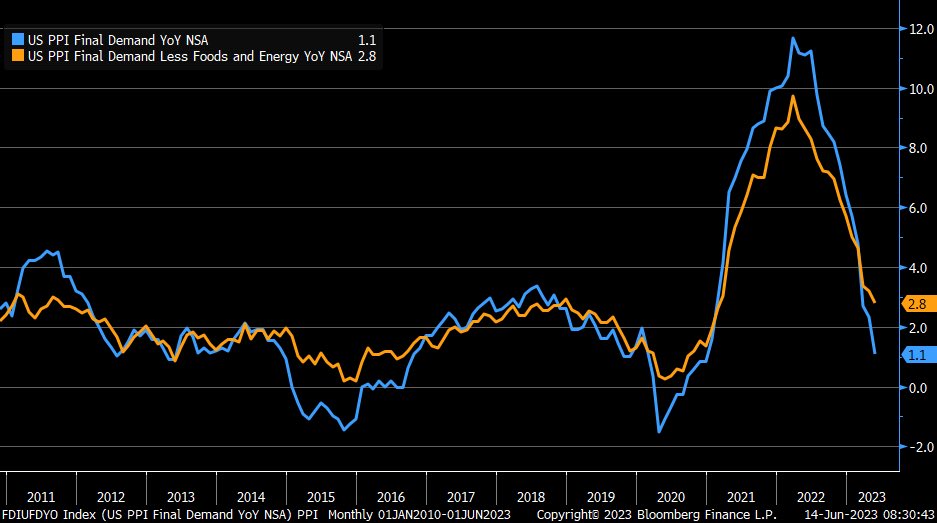
May Headline and Core Producer Price Index – Liz Ann Sonders
“Who knew the Treasury market of all asset classes would disapprove of the 3rd most intense inflation decline from a peak in the past 7 decades. In just 11 months, the inflation rate plunged -510 basis points to 4% on the nose (+3.2% on a 6mo. basis and +2.2% over the past 3mo.).” – David Rosenberg @EconguyRosie, Jun. 13

“The question always comes – why isn’t the S&P 500 signaling a recession? Answer: it is. The most economic sensitive areas are down -33%: transports, consumer discretionary, and banks. Behaving as they did heading into the 1990-91, 2001, and 2007-09 downturns.” – David Rosenberg @EconguyRosie, May 25
BofA’s Hartnett Sees Big US Stock Rally Followed by Big Collapse… “The S&P 500 may have entered a technical bull market last week, but Bank of America Corp.’s Michael Hartnett say it’s not the start of a new major rally in equities. The strategist who correctly predicted the selloff in stocks last year said in a note Friday he’s not convinced this is the start of a ‘brand, new shiny bull market.’ The current market looks more like 2000 or 2008, with a ‘big rally before big collapse,’ Hartnett wrote in the bank’s weekly report on investment flows in various asset classes.” – Bloomberg, Jun. 16

Lastly, May’s manufacturing ISM and today’s consumer sentiment data:
Manufacturing ISM Contracts 7th Straight Month, New Orders Down 9 Months… “The ISM fell deeper into contraction with prices plunging.” – Mish Shedlock, Jun. 1


Let’s close shop tonight with a deep dive into the economic situation with David Rosenberg’s interview at Wealthion and Tucker Carlson’s take on our wannabe dictator.
Don’t believe the hype! Economy a dead man walking – Wealthion, May 31
Tucker Carlson on Twitter Ep. 4 / Wannabe Dictator – Jun. 15
Plan Your Trade, Trade Your Plan
TraderStef on Twitter, Gettr / Website: TraderStef.com
Headline Image Courtesy of Beach Grit & Andy Brandy Casagrande
