How are you enjoying $1,600 bitcoin? Two weeks ago, I posted a technical analysis article indicating that the cryptocurrency king will hit this mark. At the time, bitcoin was trading at just under $1,200, meandering in an admittedly frustrating consolidation channel. A +30% move would go a long ways in rejuvenating momentum and sparking fresh investment interest.
Long-time bitcoin holders are familiar with just how quickly cryptocurrencies can swing. But for newcomers — especially those students of the traditional mutual fund investment vehicle — a 30% gain well inside of a year is almost too good to be true. As a professional working in the Wall Street machinery, I can empathize with those concerns.
But what I have learned from prominent experts, such as Merrill Lynch Vice President John J. Murphy and commodities expert David Morgan, is that all frequently traded securities exhibit recurring and consistent patterns. More often than not, these patterns culminate towards similar trajectories, thereby making forward guidance easier to predict.
In the cryptocurrency market, I noticed that bitcoin initiated a triangulation pattern early this year — a sharp rise, followed by a correction, and ultimately resulting in a recovery to parity and beyond. This same pattern was evident at the time I wrote my article, leading me to conclude that bitcoin would hit $1,600. From the current consolidation that’s occurring at this price point, I’d say that this level is fairly significant.
Loosely speaking, the triangulation pattern is an example of regression analysis. In the most technical terms, regression analysis is the search for relationships between independent variables and dependent variables. For bitcoin and the vast cryptocurrency markets, the dependent variable is the asset price. The independent variable is anything that affects the price.
On Wall Street, the fundamentalist approach is the most popular. This theory states that the financial performance of a company (ie. its earnings) is the independent variable that affects the price of its stock. However, many stocks have wild upside moves despite shedding cash flow and maintaining negative earnings.
To get around this problem, analysts such as the aforementioned John Murphy, suggested that chart patterns are the independent variables. That is, recurring patterns between the ever-evolving psychology between bulls and bears are the ultimate drivers of asset price. This theory is called technical analysis.
With bitcoin, I would argue that the most appropriate independent variable to utilize in regression analysis (or technical analysis specifically) is recurring market patterns. For whatever reason, perhaps the presumed safety in familiarity, human behaviors are redundant. This is the reason why people say “history always repeats itself.”
The same is likely true for financial markets. This is the reason I was able to pick off the $1,600 bitcoin price target with near-pinpoint accuracy. And although past results are no guarantee of future performance, another example of regression analysis forecasts an even bolder bitcoin price target — $3,065.79.
How in the world did I get such a specific figure? I first noticed that bitcoin has a predominant trend — the rounding bottom pattern. This is characterized by a sharp spike in price point, followed by a shallow, U-shaped slide-and-recovery swing, which then culminates in an even larger spike. When looking at the charts, the price action resembles a soup bowl.
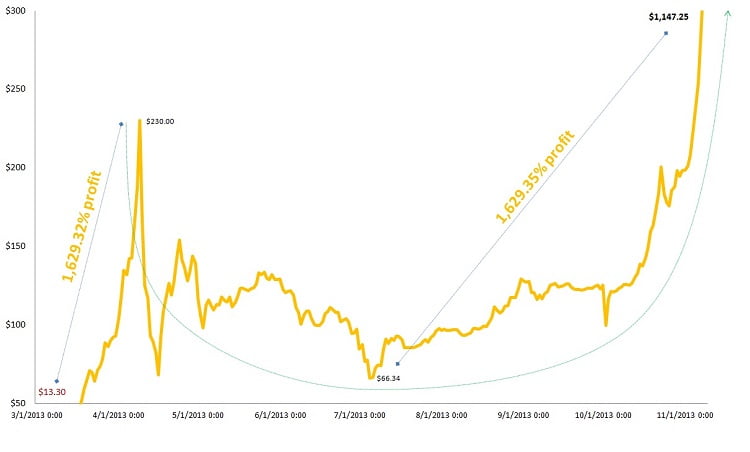
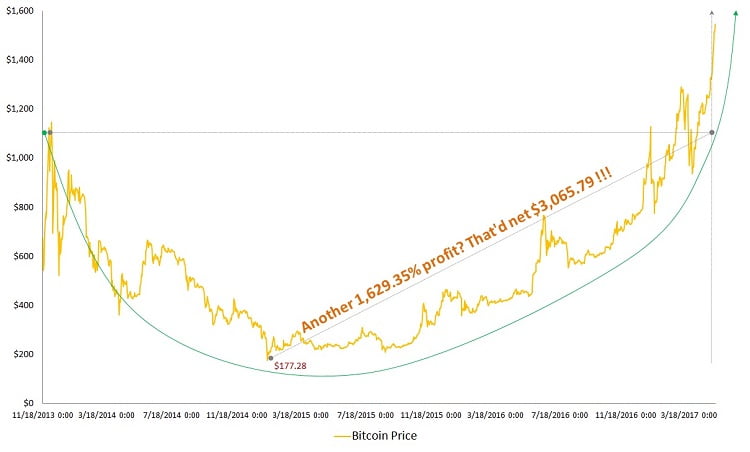
Between the spring of 2013 to November of that same year, bitcoin developed this “soup bowl” pattern. Coincidentally, between November 2013 until now, we are in the tail end of another soup bowl. It stands to reason, according to regression, that if the first soup bowl resulted in a blow-off move, then the second soup bowl will react in a similar manner.
Interestingly, between January 1, 2013 and April 9, 2013, bitcoin gained 1,629.32%. When the cryptocurrency collapsed later in the summer, the price fell to $66.34. From there, bitcoin made a record-breaking leap to $1,147.25 in November, a benchmark that was only just exceeded. The growth from trough ($66.34) to peak ($1,147.25) was 1,629.35%.
That’ a pretty remarkable coincidence. But again, history repeats itself. Furthermore, bitcoin is the digital financial aggregation of the global community. If indeed human behavior is redundant, then bitcoin itself is redundant.
From this regression, we can apply a 1,629.35% growth rate to the trough of our second soup bowl. If we do, we’d have a bitcoin price of $3,065.79.