We see a bearish evolution in precious metals. It is evidenced mostly by the price action in silver, combined with the COT report in the silver futures market COMEX.
First and foremost, our key indicator when it comes to the short and medium term outlook for precious metals, is the rate of change of net short positions from commercial traders. Note that we are referring to “rate of change”, not the net position per se.
If the rate of change is high, then it serves as “stopping power” to a rally. Alternatively, with a low rate of change of net shorts, the rally is not capped by commercial traders, and there is room to the upside.
The first chart makes the point, specifically the black circle at the right. It shows the fast accumulation of net short positions by commercial traders (red bars).
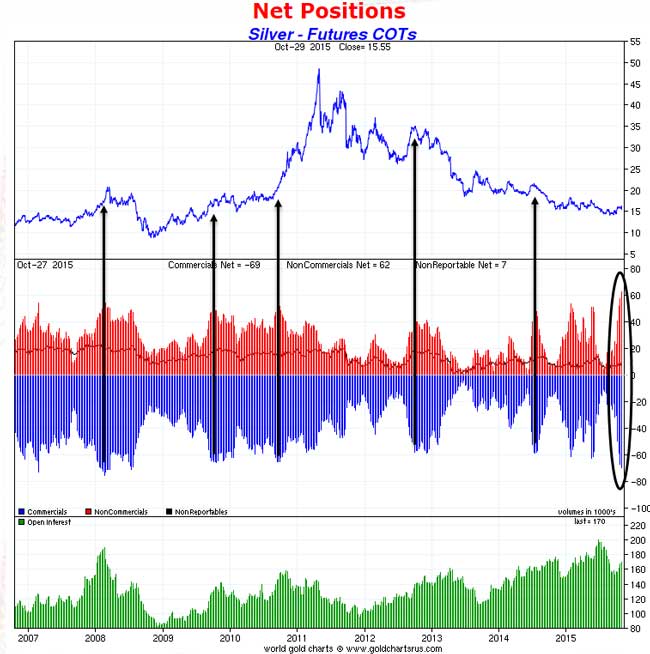 Source: Sharelynx
Moreover, by observing what happened in the last 9 years when the same net short levels were achieved, we conclude that in all except one case the rally was capped, and lower lows followed. The only exception is the fall of 2010, where silver started a monster rally. Note that conditions were truly different in COMEX silver, in the sense that the net short position was already extremely high for a year.
Given the above, it appears that our key indicator, which is the “rate of change”, is the key determinant.
Next to that, when looking at the price chart of silver, see below, we conclude that silver was not able to hold about its 200 day moving average (DMA). Also, the reversal that took place above the 200 DMA was extremely sharp, which is a bearish signal.
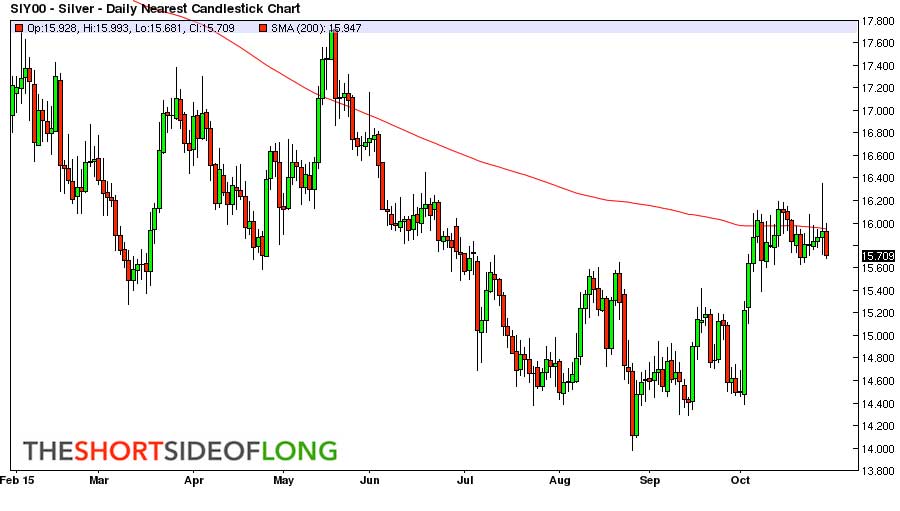 Source: Short Side Of Long
This does not bode well for the short and medium term. We anticipate at least a test of the recent lows; even a lower low is in the cards. However, the good news is that it could become the final (washout) bottom, setting up for a huge buying opportunity!