One of our favorite ratios is the gold to silver price ratio. It is important to understand how to interpret that ratio, and, even more importantly, how NOT to use it. When it comes to the gold to silver ratio, we would recommend not to use it as a short term indicator, or, even worse, a timing indicator. That’s because it is not a technical indicator, but rather a long term trend indicator.
When looking at the 2-decade trend of the gold to silver ratio, we observe an extremely interesting fact: each time the ratio has reached the 80ish area, a trend change has taken place, which implied that the silver price started rising sharply.
Examine the chart below, which indicates the gold to silver ratio with the yellow dotted line (right axis), and the silver price with the grey line (left axis).
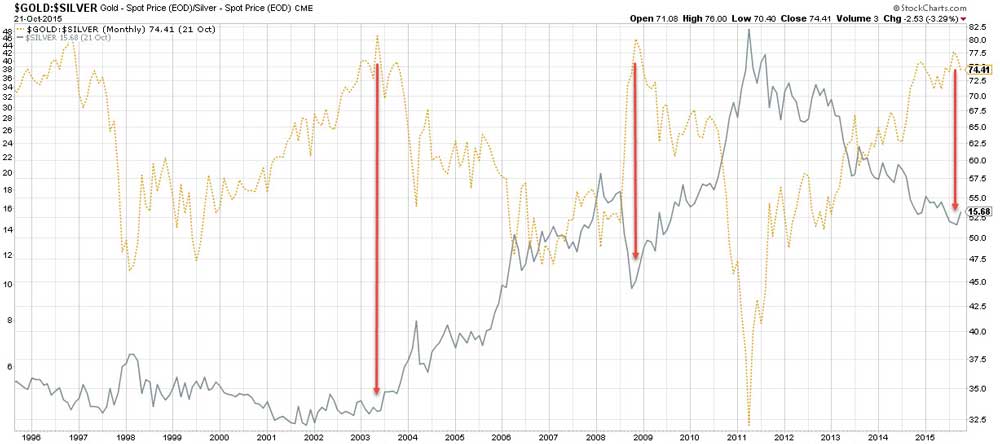
In 2003 and 2008, the gold to silver ratio reached the upper border of its long term range. Right after, the price of silver started rallying.
The chart could make you think that 1997 was an exception, as the rally that followed looks not as strong as the other two. Make no mistake, that is an optical illusion, as silver was trading at a much lower price at that time, so the rally does not look that extended. However, in absolute terms, silver almost doubled in a matter of months (from 4 to 7 USD/oz).
It seems that a strong rally is about to start right here right now.