The dominant theme in financial markets this week that will have implications for cross-border currency valuations are monetary policy decisions by the Federal Reserve, Brazil, Russia, Switzerland, and the U.K. The China trade war negotiations will inject significant volatility if an agreement (or lack thereof) parades across mainstream media headlines this week.
China eases foreign investment curbs with new law – Financial Times, Mar. 17
Proposed Trump-Xi summit to end trade war may be pushed back to June – MarketWatch, Mar. 18
Two currencies facing the most risk this week are policy decisions with the sterling (GBP) at the Bank of England (BoE), with an indecisive Brexit debacle looming in the background, and how the Fed’s FOMC TaperCaper decision and Powell’s subsequent press conference will influence the dollar (USD) this Wednesday. That dynamic will certainly have implications for the EUR, which is the second most liquid currency in the Forex market. Brexit policy decisions carry fundamental weight for the European Union (E.U.) by laying out a framework for other countries that choose to follow the U.K.’s divorce from the E.U. The FOMC decision will raise the profile of the EUR following the European Central Bank’s (ECB) decision last week to join the TaperCaper party and reintroduce its targeted longer-term refinancing operations (TLTRO) programs, aka QE.
Here is why almost nobody likes the ECB’s ‘roach motel’ cheap money policy for banks… “The European Central Bank on Thursday took a knife to euro zone growth forecasts and extended a fresh lifeline of cheap lending to banks, unnerving investors and underscoring the diminishing returns of easy money.” – Yahoo Finance, Mar. 7
U.K. Speakers Squashes Prime Minister’s Hope for Third Brexit Plan Vote… “The speaker of Britain’s House of Commons said Monday he will not allow the government to present Prime Minister Theresa May’s Brexit plan for a third vote, likely dashing May’s hope of pushing the measure through at the last minute before she meets with European Union leaders later this week.” – U.S. News, Mar. 18
The Fed has made it clear since January that it will patiently pause interest rate hikes, as the Fed Funds futures have priced in a 28% chance of a rate cut by the end of 2019. That will emphasize a focus by traders on the details of this week’s FOMC policy decision on the quantitative tightening (QT) of its balance sheet going forward. If the Fed clearly signals a slowing or halt in the reduction of its balance sheet, that would raise questions about the underlying health of the U.S. economy. Keep a close eye on the EUR/USD price action in the near-term because a rally in the EUR due to Brexit indecisiveness would add additional fuel to a potential gold rally if the FOMC policy decision also drives the USD lower.
Look for Gold to Rally if FOMC Economic Projections are Dovish – FxEmpire, Mar. 17
The Betting on the Fed This Week… “When the Federal Reserve’s Federal Open Market Committee reveals its latest thinking (or some of it) on Wednesday, many Wall Street prognosticators believe the FOMC will announce an end to its short-term interest rate hikes and to its balance sheet reduction.” – Chief Investment Officer, Mar. 18
Before moving onto the USD technical analysis, consider the following when exclaiming a strong or weak USD:
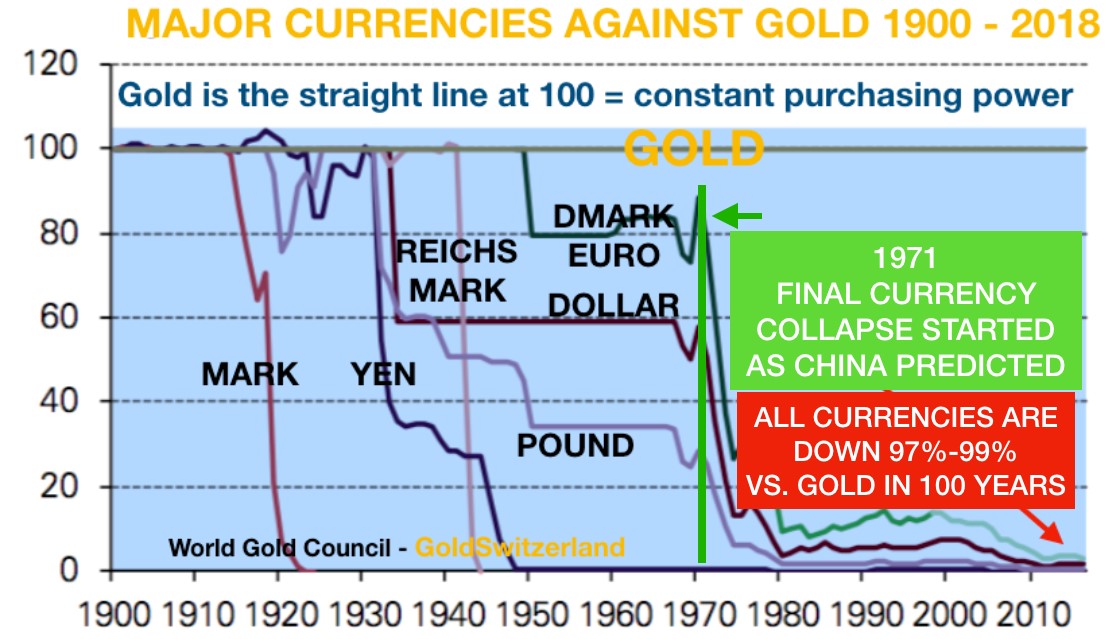
“The Value Of The Dollar Has No Guarantee Whatsoever” – Gold Switzerland, Feb. 6
Trump blasts Fed over dollar – Yahoo Finance, Mar. 4
Santelli Exchange: Former Trump Economic Advisor on the dollar – CNBC, Mar. 5

To view a larger version of any chart, right-click on it and choose your “view image” option.
“A weighted average of the foreign exchange value of the U.S. dollar against a subset of the broad index currencies that circulate widely outside the country of issue. Major currencies index includes the Euro Area, Canada, Japan, United Kingdom, Switzerland, Australia, and Sweden. For more information, see trade-weighted indexes.” – FRED
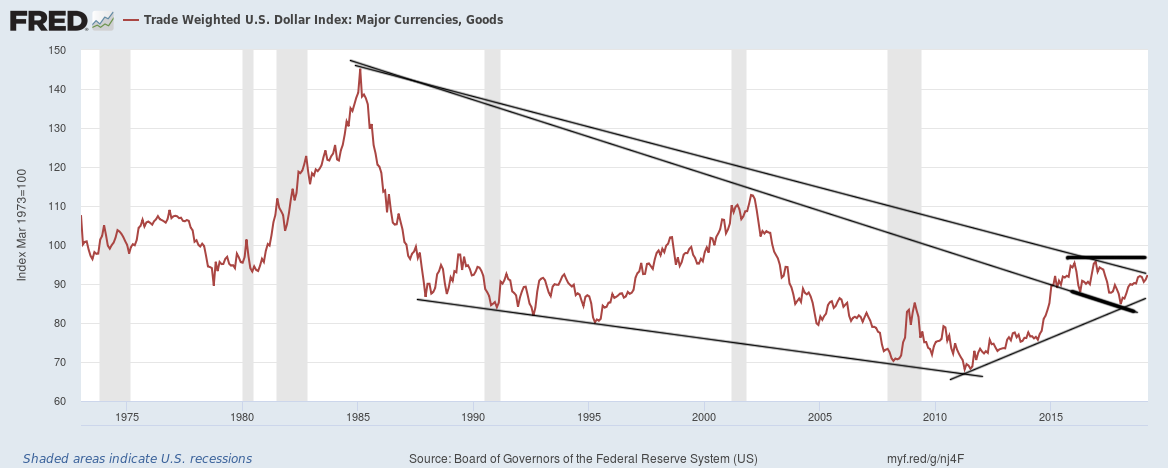
USD weekly chart as of Mar. 18, 2019, 5pm EDT…

First, here is an excerpt from my weekly chart analyses found at “The Good, the Bad, and an Ugly USD Dilemma,” published on Jan 13, 2019.
“There is a Broadening Top drawn back to the 2015 high… A pullback (rally) back above the Broadening Top Lower trendline and 50 Exponential Moving Average (EMA) occurred as per a Broadening Top playbook…

The price advance in this pullback is a potential Dead Cat Bounce… A 50/200 EMA did not Death Cross … and a trendline of support drawn back to May 2018 developed… The price has fallen for the past four weeks and printed a $95 low on this week’s candlestick, right on top of the 50 EMA and just above the 100 EMA. The Jan. 11 close was $95.66. Take note of the two Fibonacci confluences that multiply resistance and/or support strength… The DMI-ADX is breaking down into negative territory, while the StochRSI is already there and bottoming out… The MACD has slightly crossed over to the negative, and the black histogram has printed a bar to the downside… The USD chart is a tough call due to the coalescing of geopolitical, domestic, and global economic factors that may weigh heavily upon the dollar’s price action and perceived safe haven reserve status. The USD may kneejerk back into the uptrend based on news flow, but not for long as the world is fleeing the dollar hegemony. When such a confluence takes place, it is prudent to focus on the chart and ignore fundamentals or news-driven volatility.”
Not much has changed with the USD chart since Jan. 13, as the price continues to chop within a tight range below the topside Fibonacci confluence and above the 50 EMA, and failed to take out the Dec. 2018 highs when challenged in late Feb. 2019. A Rising Wedge is added to the chart this week, and they break to the downside more often than not, which would confirm the Broadening Top’s bearish Dead Cat Bounce (pullback). The 300 and 500 Simple Moving Averages (SMA) and all the EMAs continue to line up to support a bullish move vs. the overall chart patterns and studies that are giving a divergent signal, which is why we see price chop rather than a decisive move in either direction. The DMI-ADX never crossed over to a negative momentum, but instead remains indecisive with a flattened stance. The StochRSI has pivoted twice into positive territory and failed, and it has been trending downward overall since Dec. 2018. The MACD remains negative and continues on a slow downward trend.
As noted in the January analysis, the USD chart is a tough call right now due to the coalescing of several factors, but the bigger picture remains bearish unless a bullish signal appears with conviction in the chart. The FOMC meeting and decisions concerning Brexit in the U.K. may break the stalemate this week.
Trading Places – Born a Trader or Teach a Trader
https://youtu.be/tFcyEVnIoes
Plan Your Trade, Trade Your Plan
TraderStef on Twitter
Website: https://traderstef.wordpress.com
